Figures & data
Table 1 The Demographic Features of Patients with COVID-19 in a Hospital in Shanghai, China
Table 2 The Virus Nucleic Acid Detection (NAD) Tests for COVID-19 Patients in a Hospital in Shanghai, China
Table 3 The Influencing Factors Associated with the Slope Value for Ct Changes Based on Linear Regression for Nucleic Acid Detection (NAD) Tests Among COVID-19 Patients in Shanghai, China
Figure 1 The distribution of the time interval for each nucleic acid detection (NAD) test was based on setting Time 1 (T1) as the baseline among patients of different sexes and ages with COVID-19 infection.
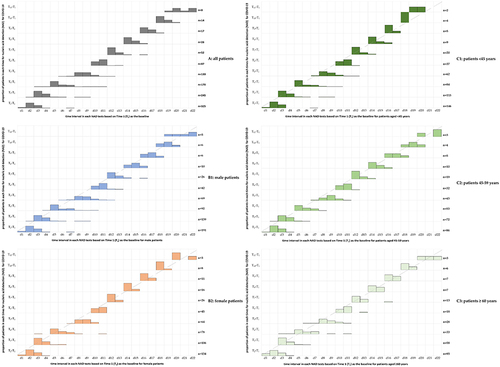
Figure 2 Comparison of minimum, maximum, median, and mean individual cycle threshold (Ct) values among COVID-19 patients of different sexes and ages.
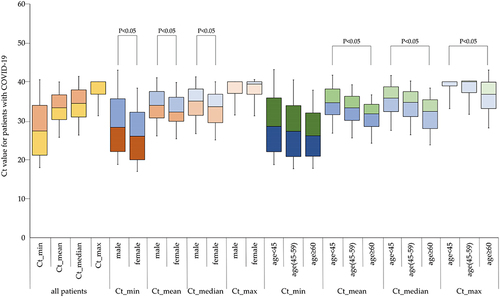
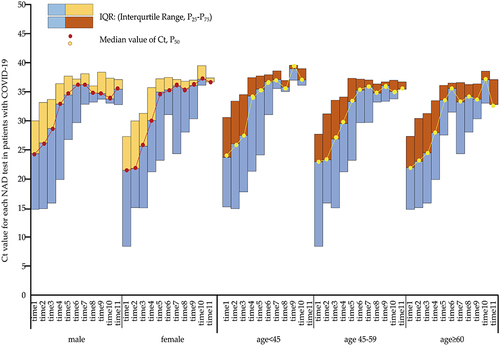
Figure 3 The cycle threshold (Ct) value for each nucleic acid detection (NAD) test among patients of different sexes and ages with COVID-19 infection.