Figures & data
Table 1 Characterizations of Participants. CHOFU, Children’s Hospital of Fudan University, WCHFU, West China Hospital, Sichuan University
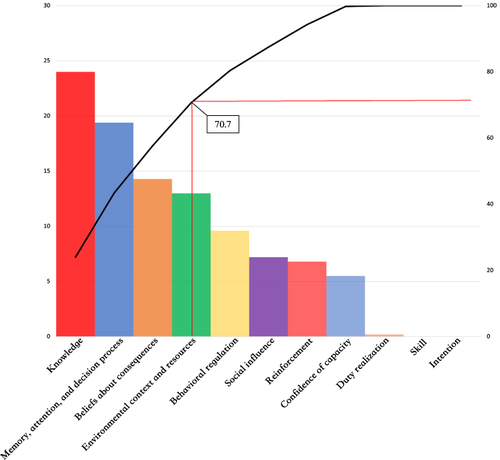
Figure 1 Pareto distribution of percentage contribution of each factor. Each column displays the percentage of each factor, which is aligned to the left vertical axis. Each factor is plotted as the cumulative percentage and fits the curve, which is aligned to the right vertical axis. The first four factors (knowledge, memory, attention and decision process, beliefs about consequences, and environmental context and resources) are the major factors, whose cumulative composition is 70.7%.