Figures & data
Figure 1 Participant information.
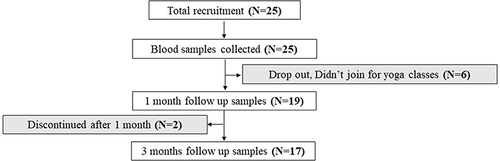
Table 1 Shows the Details of Common Yoga Protocol (CYP) Intervention
Table 2 Demographics and Anthropometric Details. Data Was Analyzed Using Paired t-Test. N = 17, **p <0.01
Figure 2 Figure showing attendance record of the participants for 3 months of intervention.
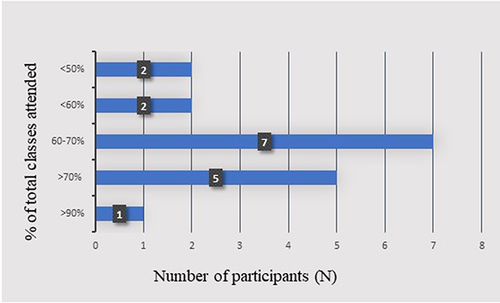
Figure 3 Enumeration of CD34+ cells before and after 1 month and after 3 months of CYP practice. (A) Scatter plot of enumeration CD34+ cells total blood cells, P1 shows total leukocyte population, P2 depicts the total CD45+ population, P3 is the CD34 population from the total CD45 population and P4 is the dim CD45+ (B) Box plot depicting quantified CD34+ cell population. **p≤0.01, Degrees of Freedom=2, Effect Size, W= 0.405.
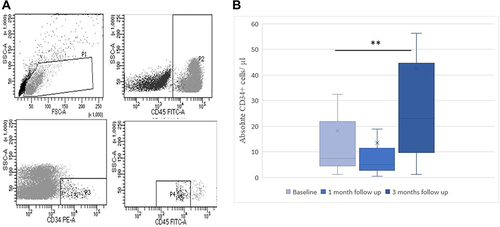
Figure 4 Box plot of Lipid profile at baseline, after 1 month and after 3 months of CYP practice (A) Cholesterol, Degree of Freedom = 2; Effect size, W = 0.027 (p = 0.630). (B) Triglycerides, Degree of Freedom = 2, Effect size, W = 0.064, p = 0.336. (C) HDL, Degree of Freedom = 2; Effect size, W = 0.122 (p = 0.126). (D) LDL Degree of Freedom = 2; Effect size, W = 0.010 (p = 0.838). (E) VLDL Degree of Freedom = 2, Effect size, W = 0.064, p = 0.336. Data was analysed by using SPSS Friedman K related samples test, N = 17.
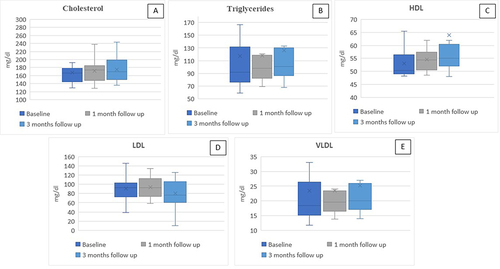
Table 3 Table Showing Levels of Angiogenesis Markers, ie, VEGF, Angiogenin and BDNF at Baseline, After 1 Month and After 3 Months of CYP Practice. Data Was Analyzed Using SPSS Friedman Related Sample KS Test. N = 17, **p = 0.002
Table 4 Table Showing Pre and Post Effects of Psychological Assessment. Data Was Analyzed Using SPSS Paired Sample t-Test. N = 17, *p < 0.05, **p <0.01
Table 5 Table Showing Correlation Between the Change in CD34+ Cells, Lipid Parameters and Biochemical Parameters After 1 Month of CYP Practice. Data Was Analyzed Using SPSS Spearman Correlation Analysis. N = 17, *p ≤ 0.05, **p ≤ 0.01, ***p ≤ 0.001. the table alignment should be proper, the empty boxes can be deleted.
Table 6 Table Showing Correlation Between the Change in CD34+ Cells, Lipid Parameters and Biochemical Parameters After 3 Months of CYP Practice. Data Was Analyzed Using SPSS Spearman Correlation Analysis. N = 17, *p ≤ 0.05, **p ≤ 0.01, ***p ≤ 0.001the table alignment is not proper.
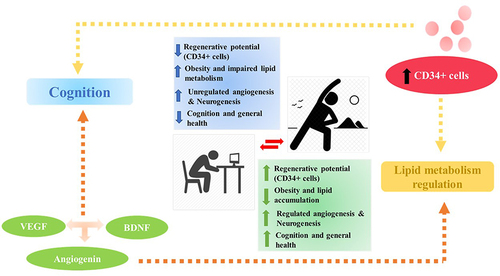
Figure 5 Schematic showing effects of Yoga induced through the regulation of neurogenesis and angiogenesis pathways via CD34+ cells number and Lipid metabolism. ![]()