
Figures & data
Table 1 Baseline Characteristics of Included Population
Table 2 Comparison of Cognitive Function Scores in Patients with Vascular Dementia Before and After Treatment (Scores, )
Figure 1 Scatter plot of MMSE total score before and after the intervention of CCRT.
Abbreviations: CCRT, Computer-assisted Cognitive Remediation Therapy; MMSE, Mini-Mental State Examination.
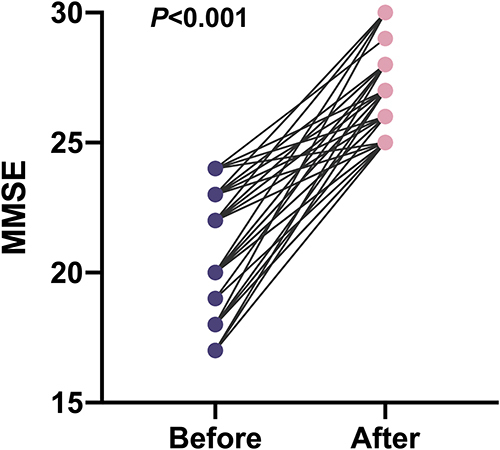
Table 3 Comparison of Scores for Social Function and Daily Life Ability in Patients with Vascular Dementia Before and After Treatment (Scores, )
Table 4 Comparison of Quality of Life Scores in Patients with Vascular Dementia Before and After Treatment (Scores, )