Figures & data
Table 1 Descriptive Tables of Demographic Variables, N= Number of Participants, (n=2410)
Table 2 Questions to Assess Knowledge, Practice, and Attitude Towards Influenza Vaccine During the COVID-19 Pandemic (Correct Answer Percentage)
Table 3 Association of Demographic Characteristics of Participants and Knowledge, Practice, and Attitude Score (n=2410)
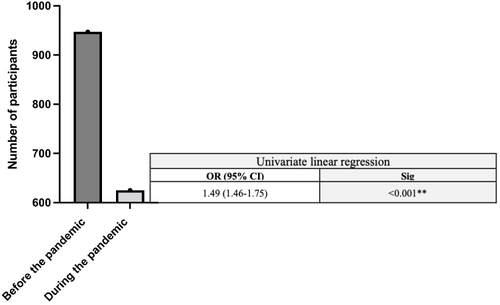
Figure 1 Impacts of COVID-19 pandemic on the influenza vaccination in Saudi Arabia. **P-value≤0.001.
Abbreviations: OR, Odds Ratio; CI, Confidence interval; Sig, Significance.