Figures & data
Figure 1 Timeline of robotic spine surgery at Kaohsiung Medical University Hospital (KMUH). The orthopedic surgeons joined the robotic spine surgery team in August 2014. At that time, 255 cases and 1237 screws had been placed successfully. (NS: cases performed by neurosurgeons).
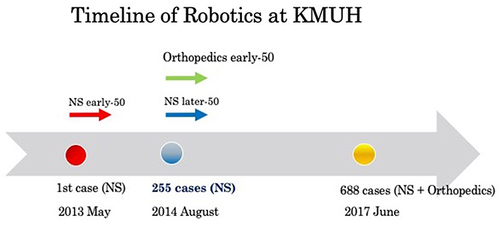
Table 1 Characteristics of Patients in Three Groups
Figure 2 Groups learning curves. The learning curve of the 3 groups and the test of parallelism were plotted. The upper part (A) is the curves of the 3 groups put combined. The lower part of the figure (B) is the curve for each group. The parallelism of these curves was tested using the parallelism F-test and showed no significance.
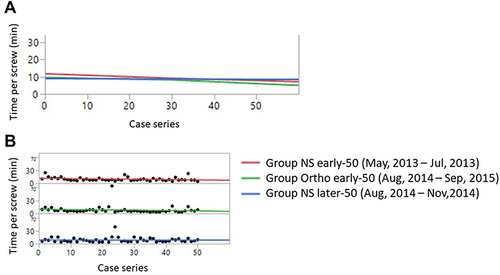
Table 2 Time per Screw and Learning Curve Between 5 Doctors
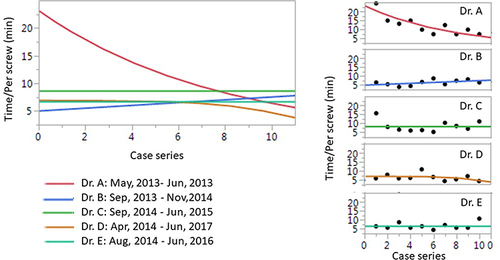
Figure 3 Individual surgeon’s learning curve. The learning curves of individual surgeons and the test of parallelism were plotted. The right side of the figure is the curve for each surgeon. The left side is the curves of the 5 surgeons combined. The parallelism of these curves, tested using the parallelism F-test, showed a significant difference among the curves.