Figures & data
Figure 1 The expression and patterns of m7G genes. (A) The chromosome location and names of these 29 m7G genes. (B) Differential expression of m7G-related genes in COVID-19 and non-COVID-19 patients. (C) Heat map of m7G-related DEGs between COVID-19 and non-COVID-19. (D) The best consensus matrix (k=2). (E) m7G genes expression between m7G clusters A and B. (F) Heat map of m7G genes expression between m7G cluster A and B.
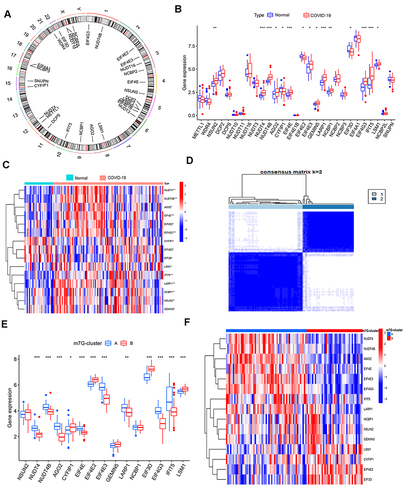
Figure 2 Immune Infiltration and functional enrichment analysis of m7G patterns. (A) Principal component analysis indicated that clustering was effective. (B) The 23 kinds of immune cell infiltration between m7G cluster A and B. (C) The correlation between m7G-related genes and immune cells. (D) The KEGG enrichment analysis of DEGs between m7G cluster A and B. (E) The GO functional analysis based on DEGs between m7G cluster A and B.
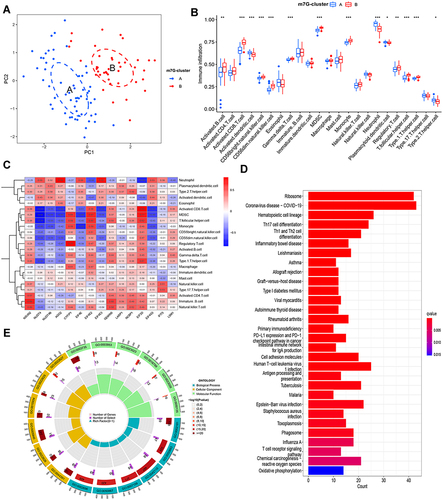
Table 1 Clinical Features in m7G Clusters
Figure 3 (A) The best consensus matrix. (B) Heat map of gene expression between gene clusters A and B. (C) The expression of m7G-related DEGs between gene clusters A and B (D) The 23 kinds of immune cell infiltration between gene cluster A and B. The m7G-score in gene clusters (E) and m7G clusters (F). (G) Sankey diagram to further visualize the relationship among the disease subtypes classification, m7G clusters, gene clusters, and m7G-score. *p-value<0.05, **p value<0.01, ***p value < 0.001.
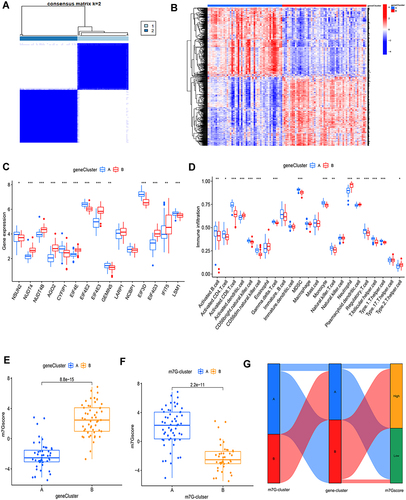
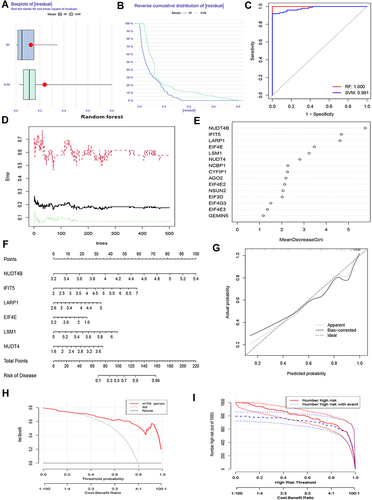
Figure 4 Establishment and validation of the prediction model. Residual (A) and reverse cumulative distribution of residual (B) were used to compare the accuracy of RF and SVM algorithms. (C) RF and SVM were evaluated by ROC curve. (D) The optimal nTree was obtained to find the disease feature genes. (E) The importance score of the relevant gene was calculated. (F) The nomogram prediction model. (G) The calibration curve revealed a good degree of agreement. (H) Decision curve analysis showed a high net benefit. (I) Nomogram models were validated using clinical impact curve analysis.