
Figures & data
Table 1 Findings from CDU and CEU Before and After Splenic Artery Embolization
Figure 1 Left: color Doppler ultrasound image. The hepatic artery blood flow signals disappeared and only the portal vein blood flow signals were displayed. Right: contrast-enhanced ultrasound image. The contrast arrived at the hepatic artery and portal vein at the same time, the hepatic artery was visualized and had small diameter and the peak intensity of the contrast was significantly lower than that of portal vein (arrow).
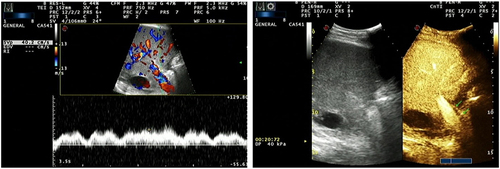
Figure 2 Left and middle: color Doppler ultrasound images. Left: the blood flow velocity was 16.7 cm/s on the hepatic artery spectrum; middle: the splenic artery velocity was 208.2 cm/s on the splenic artery spectrum; right: white arrows showed the large spleen artery and green arrows showed the fine hepatic artery.
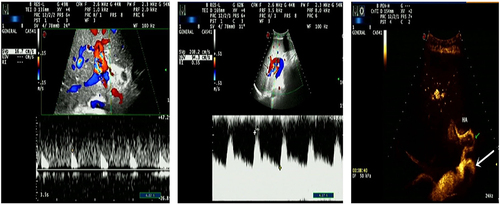
Table 2 Clinical Prognosis of 17 Patients with Splenic Artery Embolism