
Figures & data
Table 1 Comparison of General Data Between the Two Groups
Table 2 Comparison of Quality of Life Scores Between the Two Groups (Points)
Table 3 Comparison of Pulmonary Function Indexes Between the Two Groups
Figure 1 Baseline 6-min walk distance (6MWD) and change after treatment in 6MWD in the intervention and observation groups before and after treatment. *P < 0.05 compared with observation group after training.
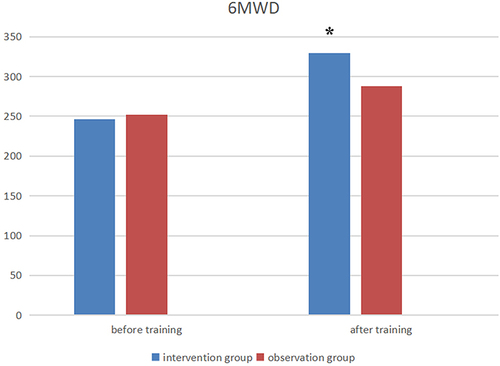
Table 4 Comparison of Sputum Excretion Between the Two Groups Before and After Treatment