Figures & data
Table 1 Demographic Characteristics of Type 2 Diabetes Mellitus Cases and Healthy Controls
Table 2 Relative Expression of miRNA-143 Among Type 2 Diabetic Cases Compared with Healthy Controls
Table 3 Relative Expression of miRNA-145 Among Type 2 Diabetic Cases Compared with Healthy Controls
Figure 1 Correlation between miRNA-143 and miRNA-145 expression among the T2DM cases.
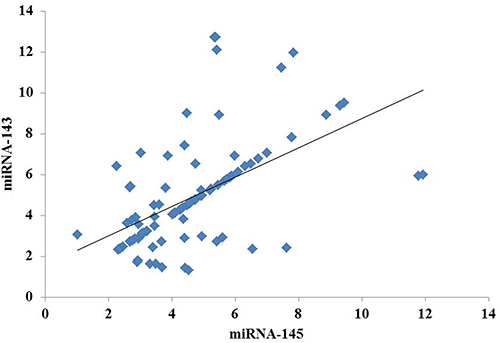
Table 4 Correlation Analysis and Coefficient of miRNA-143 and miRNA-145 with Biochemical Parameters Among T2DM
Table 5 Comparison of Biochemical Parameters with Vitamin-D Status Among the T2DM Cases
Figure 2 MiRNA expression among obese and non-obese T2DM cases. (A) miRNA-143, (B) miRNA-145.
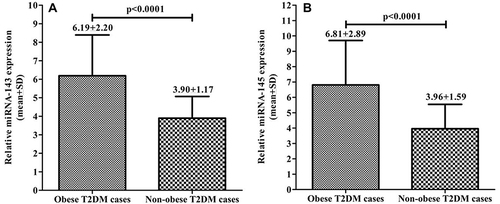
Figure 3 MiRNA expression with vitamin-D status. (A) miRNA-143, (B) miRNA-145.
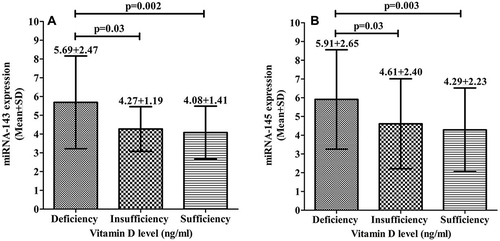
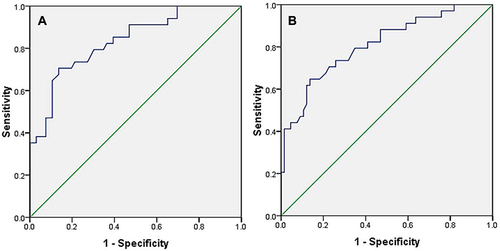
Table 6 AUC, Sensitivity, Specificity and Cutoff for miRNA-143 and miRNA-145 Between Obese and Non-Obese T2DM Cases
Figure 4 ROC curve analysis for prognostic importance between non-obese and obese T2DM cases. (A) AUC for miRNA-143, (B) AUC for miRNA-145.