
Figures & data
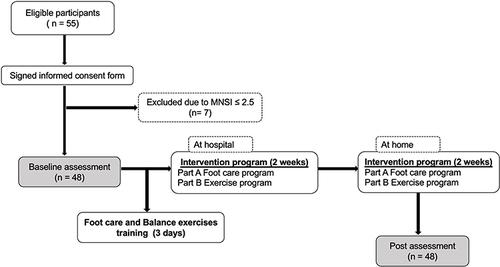
Figure 1 Study procedure.
Box 1 The Foot Care Programme
Box 2 The Balance Exercises Programme
Table 1 Baseline Characteristics of the Sample
Table 2 Results of the Mini-BESTest and the Global Rating of Change (GRC) Scale at Baseline and Post-Intervention
Table 3 Reliability and Responsiveness Indexes for Mini-BESTest
Figure 2 Comparison of mean Mini-BESTest scores between at baseline (white box) and after intervention (gray box).
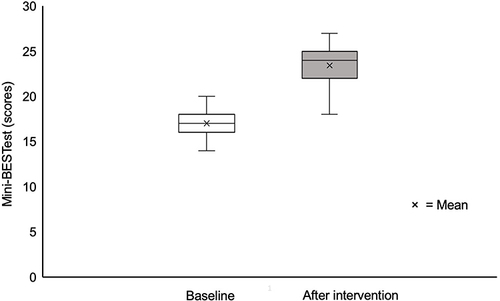
Table 4 Cut-off Value of the Mini-BESTest Change Scores According to the GRC Scores ≤3 versus >3
Figure 3 Receiver operating characteristic curve (ROC) using the Mini-BESTest cut-off score (≥ 5) (in the blue circle) to distinguish the improvement of patients by Global Rating of Change (GRC) scale; patients who improved (GRC > 3) from those who did not improve (GRC ≤ 3) with the area under the curve (AUC) (0.81 (95% CI: [0.65–0.98]).
![Figure 3 Receiver operating characteristic curve (ROC) using the Mini-BESTest cut-off score (≥ 5) (in the blue circle) to distinguish the improvement of patients by Global Rating of Change (GRC) scale; patients who improved (GRC > 3) from those who did not improve (GRC ≤ 3) with the area under the curve (AUC) (0.81 (95% CI: [0.65–0.98]).](/cms/asset/1abc1839-f854-402b-98e0-dc5670039f61/djmd_a_12154529_f0003_c.jpg)