Figures & data
Table 1 Baseline Characteristics of Patients Included in the Study
Table 2 Comparison of Clinical Outcomes Before and After the Implementation of the Traditional PC Model or the CMO-Based PC Model
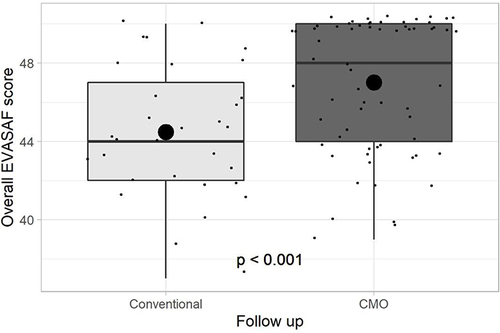
Figure 1 Global and conditional IEXPAC at baseline and week 24. (A) Global IEXPAC. (B) Conditional IEXPAC.
Notes: Dots representing the means. ****p < 0.005.
Abbreviations: CMO, Capacity- Motivation-Opportunity model; N.S., non-significant; p.adj, adjusted p-value; p.adj.sig, significant adjusted p-value; SD, standard deviation.
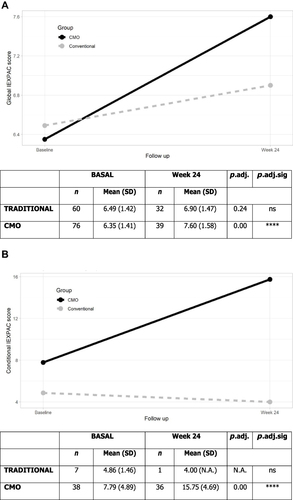
Table 3 Evaluation of Adherence to Treatment in the Two Intervention Groups After 24 Weeks
Table 4 Viro-Immunological Control
Figure 2 Evaluation of patient satisfaction using the EVASAF questionnaire.
Note: Dots representing the means.
Abbreviation: CMO, Capacity- Motivation-Opportunity model.