
Figures & data
Table 1 Participant Demographic Characteristics
Table 2 Descriptive Statistics for SSCRS_P Scores
Table 3 Principal Component Analysis
Table 4 Pattern Matrix with Loadings for Each Item on Each of the Three Factors (Rotation Method: Oblimin; Extraction Method: Principal Component Analysis)
Figure 1 Detailed results of the CFA are depicted on the structural model.
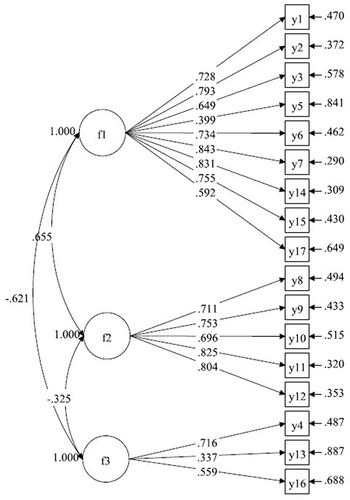
Table 5 Test–Retest Reliability Analysis
Table 6 Results of the Between-Group Comparisons of the SSCRS_P Scores