Figures & data
Figure 1 A flowchart illustrating the selection of study participants and analytical plan.
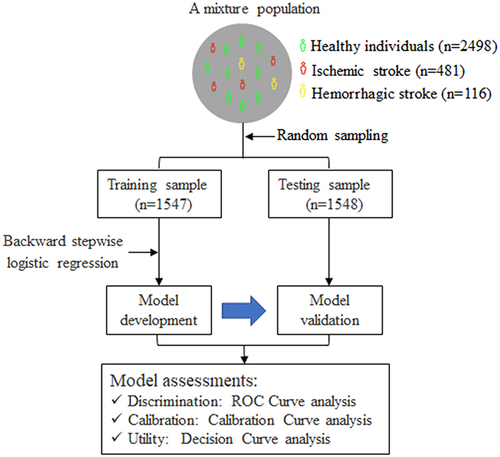
Table 1 Clinical Characteristics of Study Participants
Table 2 The Final Diagnostic Model Developed in the Training Sample
Figure 2 The receiver-operating characteristic curve illustrating the discrimination of the diagnostic model in the training (A) and testing (B) samples.
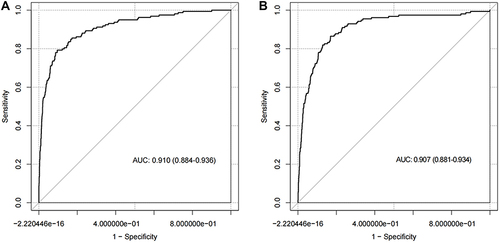
Figure 3 The calibration curve illustrating the agreement between the observed and predicted probability of ischemic stroke determined by the diagnostic model in the training (A) and testing (B) samples.
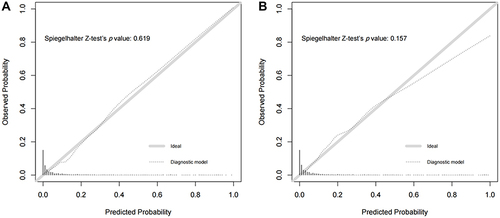
Figure 4 The decision curve for the diagnostic model in the training (A) and testing (B) samples.
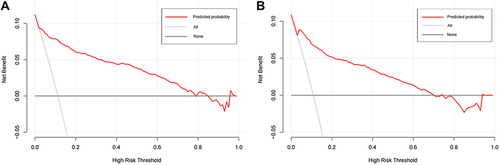
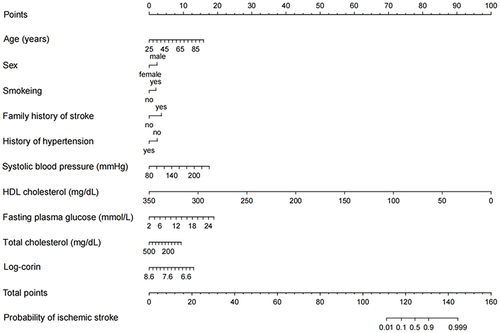
Figure 5 The nomogram for the probability of being ischemic stroke predicted by the diagnostic model.