Figures & data
Table 1 Characteristics of the Study Population at Baseline Stratified by the Lesion Groups
Figure 1 Flowchart of the participants.
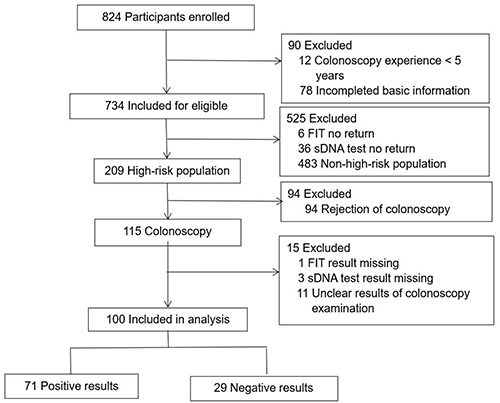
Table 2 The Sensitivity and Specificity of the Single and Combined Complementary Primary Screening Schemes
Table 3 The Kappa Value of the Single and Combined Complementary Primary Screening Schemes
Figure 2 The sensitivity and specificity of the pairwise comparisons. (A) The sensitivity of the pairwise comparisons for AA; (B) The sensitivity of the pairwise comparisons for ACN; (C) The sensitivity of the pairwise comparisons for NAA; (D) The sensitivity of the pairwise comparisons for LGIN; (E) The sensitivity of the pairwise comparisons for Positive results; (F) The specificity of the pairwise comparisons. a1, b1, c1, d1, e1, f1, APCS; a2, b2, c2, d2, e2, f2, FIT; a3, b3, c3, d3, e3, f3, sDNA test; a4, b4, c4, d4, e4, f4, APCS + FIT; a5, b5, c5, d5, e5, f5, APCS + sDNA test; a6, b6, c6, d6, e6, f6, FIT + sDNA test; a7, b7, c7, d7, e7, f7, APCS + FIT + sDNA test.
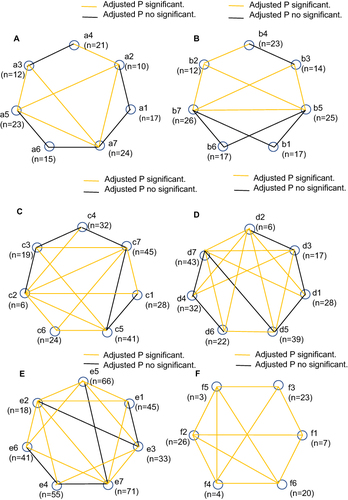
Table 4 The Double Positive Detection of the Combined Primary Screening Schemes
Figure 3 The double positive sensitivity of the pairwise comparisons. (A) The double positive sensitivity of the pairwise comparisons for ACN; a1, APCS + FIT; a2, APCS + sDNA test; a3, FIT + sDNA test; a4, APCS + FIT + sDNA test; (B) the double positive sensitivity of the pairwise comparisons for LGIN; b1, APCS + FIT; b2, APCS + sDNA test; b3, FIT + sDNA test; b4, APCS + FIT + sDNA test.
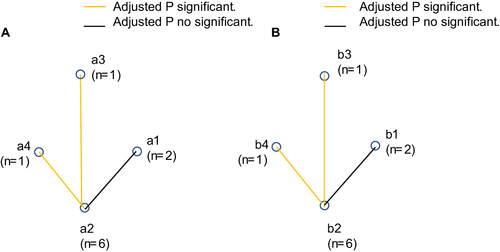
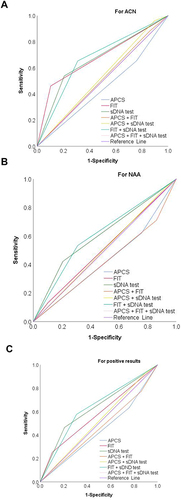
Figure 4 ROC curves comparing different detection schemes for ACN, NAA and positive results. (A) For ACN; (B) For NAA; (C) For positive results. For ACN, FIT AUC was 0.679 (95% CI: 0.534–0.824, P = 0.023), FIT + sDNA test combined scheme AUC was 0.672 (95% CI: 0.527–0.817, P = 0.029). For NAA, AUC (0.611, 95% CI: 0.480–0.743) of FIT + sDNA test combined scheme, with no significant difference. For all lesions positive results, the AUC of FIT + sDNA test combined scheme was 0.634 (95% CI: 0.514–0.753, P = 0.037).