Figures & data
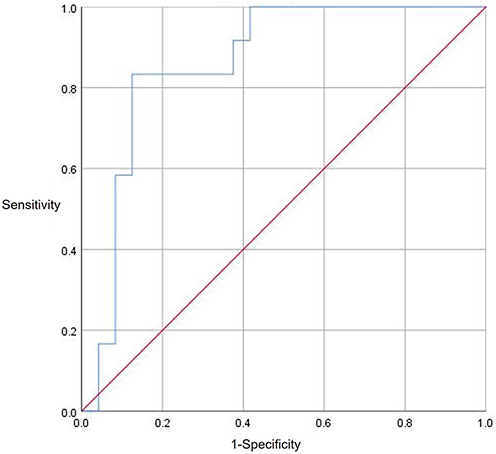
Figure 1 The flow chart of patient selection.
Abbreviations: LIS, laboratory information system; PTC, papillary thyroid cancer; RAI, radioactive iodine.
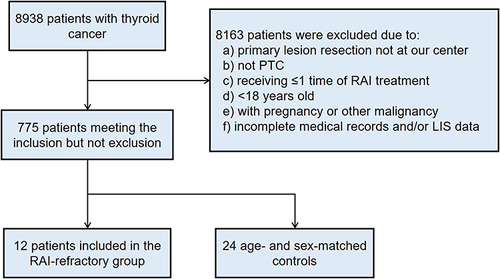
Table 1 Demographical and Clinicopathological Characteristics of Included Patients
Figure 2 The heatmap of sixteen blood biomarkers with statistical significance.
Abbreviations: AGPK, anion gap; BASO#, basophil count; FDP, fibrin/fibrinogen degradation products; LDL-Ch/TCh, low-density lipoprotein cholesterol-to-total cholesterol ratio; Na, serum sodium; NA/na, not applicable; Neu#, neutrophil count; TCO2, total carbon dioxide, Tg2/Tg1, stimulated thyroglobulin at the second I-131-to-stimulated thyroglobulin at the first I-131 ratio; TG-Ab, thyroglobulin antibody; TGB, thyroglobulin; TPO-Ab, thyroid peroxidase antibody; TT, thrombin time; WBC, white blood cell; VitD3, 25-hydroxyvitamin D3.
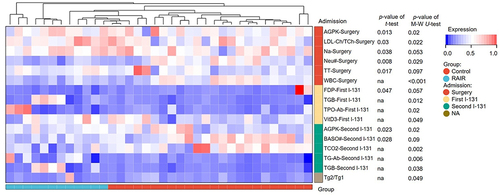
Table 2 Logistic Regression Analysis for the Association Between Blood Biomarkers and RAIR
Table 3 Predictive Accuracy of the Blood Markers and the Scoring System Based on the ROC Curve
Figure 3 The comparison of scores between the two groups. The medians and interquartile ranges were displayed here. The Mann–Whitney U-test was applied.
Abbreviation: RAIR, radioactive iodine refractoriness.
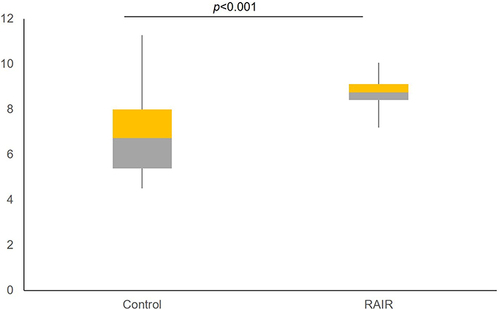
Figure 4 The ROC curve of the scoring system.