
Figures & data
Figure 1 (A) Sixty-three major infection events were recorded. Over ninety present (n=57, 90.5%) of the infection events happened within the first 6 months after the initial diagnosis of cSLE. (B) Ten patients had admitted to the intensive care unit (ICU) related to the infection event.
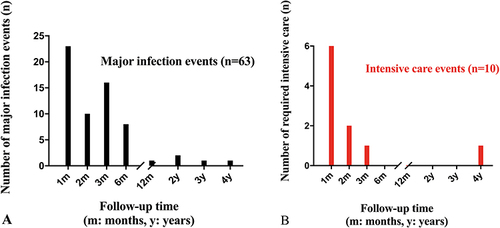
Table 1 Demographics and Characteristics of Patients with or without Major Infections Within the First 6 Months After the Diagnosis of the cSLE
Table 2 Characteristics of Major Infection Events
Table 3 Multivariate Analysis of the Factors Associated with the Major Infection Events Within the First 6-Month After the Diagnosis of cSLE
Figure 2 (A) The number and frequency of major infection events in the cSLE patients with different risk scores was presented. (B) Patients in the high risk group [score (number of predictors) ≥2] had higher rates of the major infection occurrence than those in the low risk group (score ≤ 1) during the 6 months after the diagnosis of the cSLE. (HR:14.10, 95% CI 8.43 to 23.59, P<0.001).
![Figure 2 (A) The number and frequency of major infection events in the cSLE patients with different risk scores was presented. (B) Patients in the high risk group [score (number of predictors) ≥2] had higher rates of the major infection occurrence than those in the low risk group (score ≤ 1) during the 6 months after the diagnosis of the cSLE. (HR:14.10, 95% CI 8.43 to 23.59, P<0.001).](/cms/asset/0a0087fa-3586-4acf-82cc-63b2f0274422/djmd_a_12157825_f0002_c.jpg)
Table 4 Performance of the CALL Score Evaluated by Receiver Operating Characteristic (ROC) Curve Analysis