
Figures & data
Table 1 Comparison of General Information Between the Two Groups of Patients
Figure 1 CONSORT flow diagram.
Notes: CONSORT figure adapted from Schulz KF, Altman DG, Moher D, CONSORT 2010 Statement: Updated Guidelines for Reporting Parallel Group Randomised Trials. PLoS Med. 2010;7(3): e1000251. Copyright: © 2010 Schulz et al. Creative Commons Attribution License.Citation11
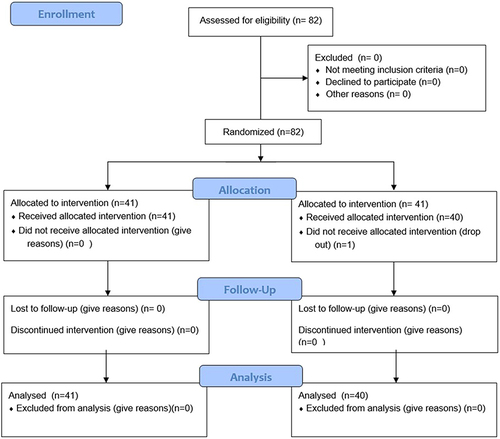
Figure 2 (a) Extracorporeal shock wave apparatus and parameter settings, (b) Extracorporeal shock wave therapy, (c) Warming acupuncture therapy.
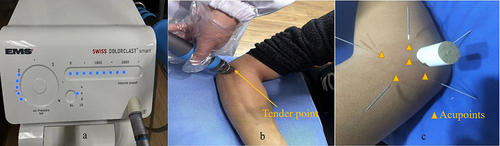
Table 2 Comparison of VAS Score Between the Two Groups of Patients Before and After Treatment (Points)
Table 3 Comparison of MEPS Score and DASH Score Between the Two Groups of Patients Before and After Treatment (Points)
Table 4 Comparison of Inflammatory Factor Levels Between the Two Groups Before and After Treatment
Table 5 Comparison of Clinical Outcomes Between the Two Groups [n (%)]