Figures & data
Figure 1 Flow chart of the participants at three follow-ups.
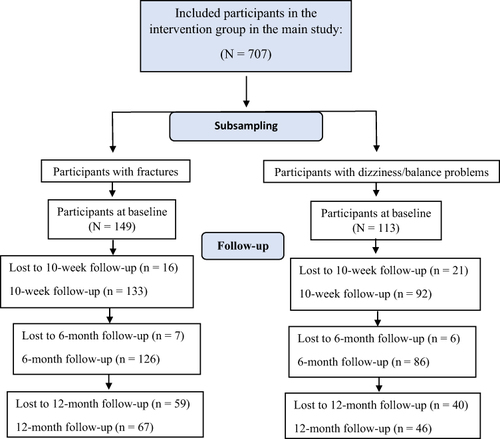
Table 1 Participant Characteristics at Baseline
Table 2 Description of Changes in Mean Difference Scores in Primary and Secondary Outcome Measures from Baseline to 10-Week, Baseline to 6-Month, and Baseline to 12-Month Follow-Up in the Fracture Group and the Dizziness/Balance Problems Group, Respectively
Table 3 Description of Group Differences of COPM-P and COPM-S at 10-Week, 6-Month, and 12-Month Follow-Up, Estimated by ANCOVA
Figure 2 Changes in sum scores in occupational performance (to the left) and satisfaction with performance (to the right) in the fracture (N = 149) and dizziness/balance problem (N = 113) group over time assessed with the Canadian Occupational Performance Measure (COPM).
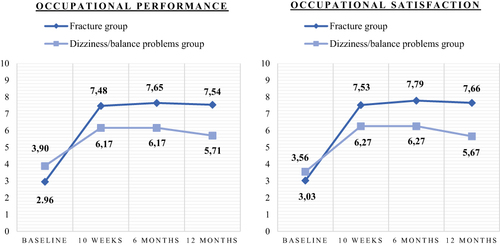
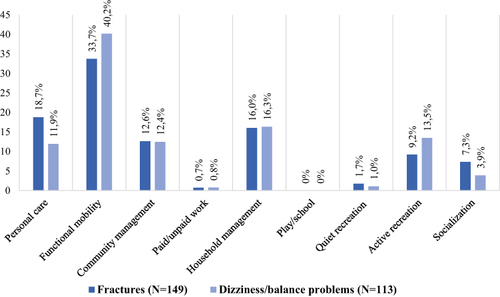
Figure 3 Percentages of occupations prioritized in the fracture group (dark blue columns, n = 587) and the dizziness/balance problems group (light blue columns, n = 386), respectively, in each of the nine sub-areas assessed with the Canadian Occupational Performance Measure (COPM).