
Figures & data
Table 1 Study Inclusion and Exclusion Criteria
Figure 1 Flow chart diagram displaying the selection method of qualified studies.
Notes: Adapted from Moher D, Liberati A, Tetzlaff J, Altman DG, Prisma Group. Reprint--Preferred reporting items for systematic reviews and meta-analyses: the PRISMA statement. Annals of internal medicine. 2009;151(4):264–269.Citation22
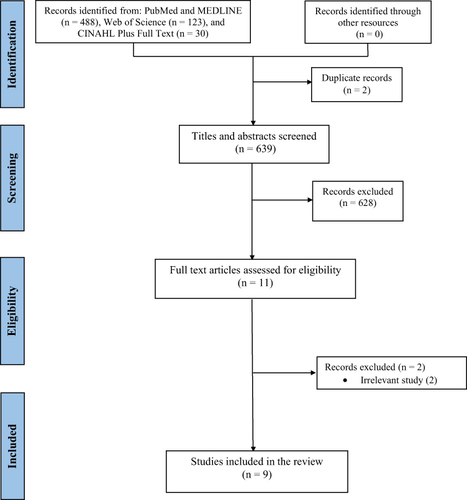
Table 2 The Characteristics of the Included Studies
Figure 2 The number of included studies by features.
Abbreviations: DWI, Diffusion-Weighted Imaging; CTA+, 8-second delay after Computed Tomography Angiography; CT, Computed Tomography; MRI, Magnetic Resonance Imaging; CTP, Computed Tomography Perfusion; CTA, Computed Tomography Angiography; NCCT, Non-Contrast Computed Tomography.
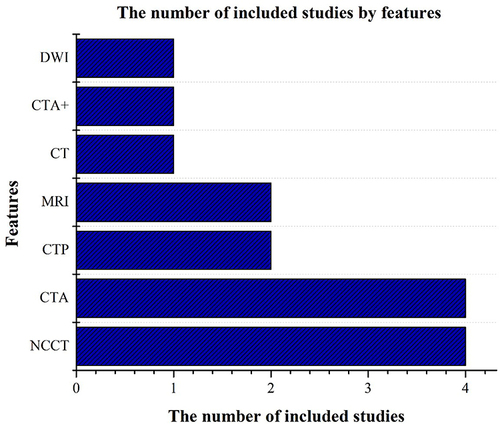
Table 3 The Optimal Results of Included Studies by the Algorithm