
Figures & data
Figure 1 Study flow chart.
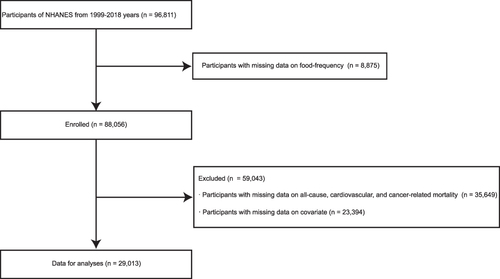
Table 1 Distribution of Baseline Characteristics of NHANES Cohort Across Tertiles of DII
Table 2 Cox Regression Analysis of DII for All-Cause Mortality in Participants
Figure 2 The restricted cubic spline plot of the association between DII with (A) all-cause mortality (B) CVD-related mortality (C) cancer-related mortality.
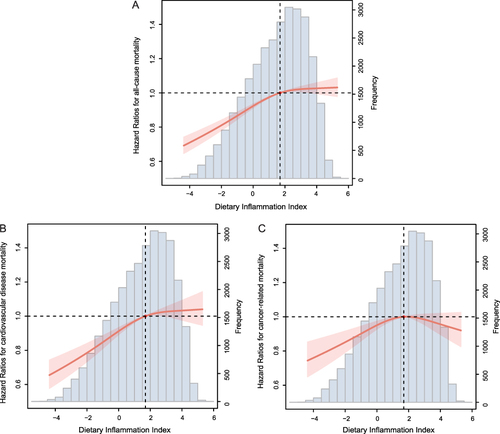
Table 3 Cox Regression Analysis of DII for CVD-Related Mortality in Participants
Table 4 Cox Regression Analysis of DII for Cancer-Related Mortality in Participants
Figure 3 Kaplan-Meier survival curve for (A) all-cause mortality (B) CVD-related mortality (C) cancer-related mortality.
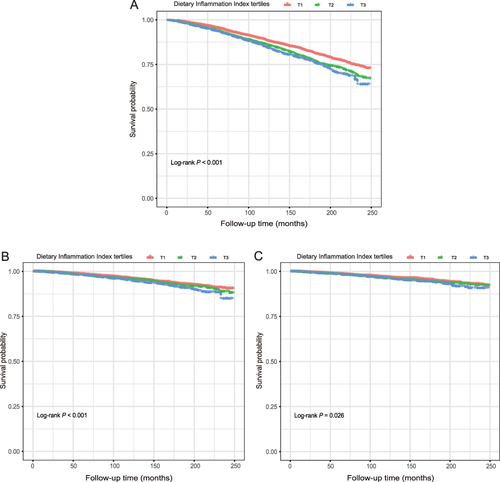
Table 5 Subgroups Analysis for the Associations of DII with All-Cause Mortality
Table 6 Subgroups Analysis for the Associations of DII with CVD-Related Mortality
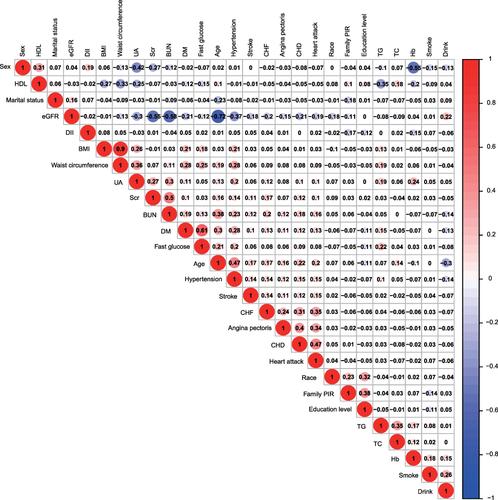
Figure 4 The association between DII and covariates.
Data Sharing Statement
The survey data are publicly available on the internet for data users and researchers throughout the world (www.cdc.gov/nchs/nhanes/).