
Figures & data
Table 1 Comparison of General Baseline Data Between the Two Groups
Figure 1 Routine blood collection method (bevel up) and optimized needle insertion method (bevel down). (A) Routine blood collection method; (B) Optimized needle insertion method.
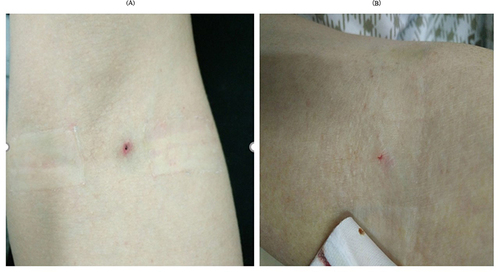
Table 2 Comparison of Blood Spill (Cases), Bruise Area (Cases), Blood Clot (Cases), and Dizziness (Cases) Between the Two Groups
Table 3 Comparison of Heart Rate (Times/Min) and Blood Pressure (mmHg) Between the Two Groups Before and After Blood Collection
Table 4 Comparison of Patient Pain Score (NRS Score: Minutes) and Blood Collection Time (Seconds) Between the Two Groups