
Figures & data
Figure 1 Tibet map with elevation. It was created in ArcGIS (Esri, California, USA). Data on elevation were obtained from https://www.gscloud.cn/.
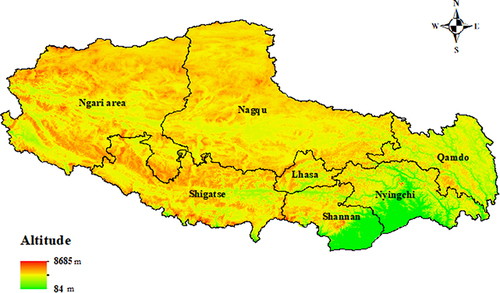
Figure 2 The health-related quality of life ecological model.
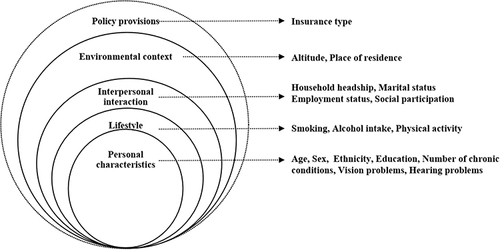
Table 1 Dependent and Independent Variables
Table 2 EQ-5D-3L Frequencies and Proportions by Dimension and Level Among Elderly Individuals in Tibet. n (%)
Table 3 Participant Characteristics of Elderly Individuals in Tibet
Figure 3 LASSO regression plots. A, EQ-VAS; B, EQ-5D-index. The influencing factors associated with HRQoL were identified by the LASSO regression. These factors included the nine most powerful predictors for EQ-VAS (Age, Sex, Number of chronic illnesses, Reported hearing problems, Physical activity, Employment status, Social participation, Place of residence, and Insurance type) and the seven most powerful factors for EQ-5D-index (Age, Number of chronic illnesses, Reported vision problems, Reported hearing problems, Physical activity, Employment status, and Social participation).
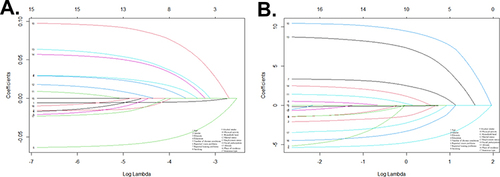
Figure 4 Cross-validation plots. A, EQ-VAS, shows the coefficients of each predictor when the predictors were included in the LASSO regression model for EQ-VAS; B, EQ-5D-index, shows the coefficients of each predictor when the predictors were included in the LASSO regression model for EQ-5D-index.
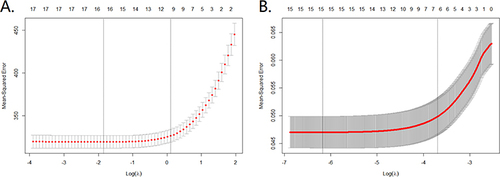
Table 4 Tobit Multivariate Regression