
Figures & data
Table 1 Descriptive Characteristics of Students Participating in the Survey (N=403)
Figure 1 Distribution of students awareness of HPV vaccine, by gender and college.
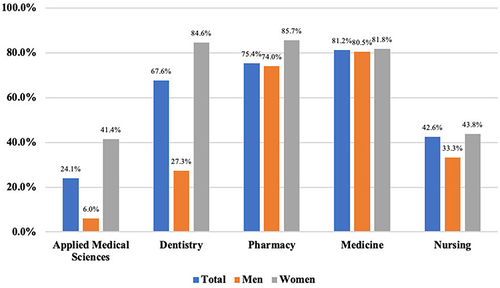
Table 2 Assessment of Knowledge About HPV Vaccine Among Those Who Have Heard of the Vaccine, by Gender and College (N=201)
Figure 2 HPV vaccine hesitancy by gender and college. Participants who had never received the HPV vaccine were asked about their willingness to receive it with the question: “Would you be interested in getting the HPV vaccine?” Anyone who responded with “I don’t know” or “No” was considered hesitant. Notes: Significant differences in vaccine hesitancy were observed between men and women within the same college (p-values < 0.01), except for the College of Nursing (X2=2.1; df=1; p-value=0.21). When comparing vaccine hesitancy across colleges within the same gender, significant differences were found in the women’s group (X2=29.3; df=4; p-value <0.0001), but not in the men’s group (X2=6.5; df=4; p-value=0.16).
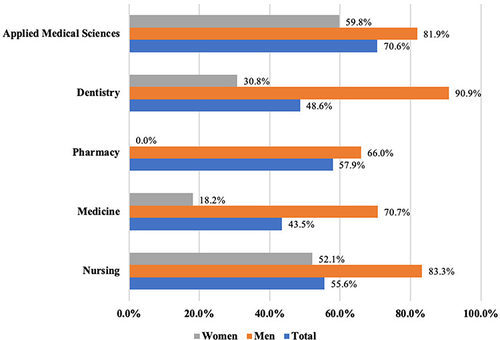
Figure 3 Reasons for hesitancy towards HPV vaccine by gender. *X2=27.2; df=1; p-value < 0.0001. **X2=5.1; df=1; p-value=0.024.
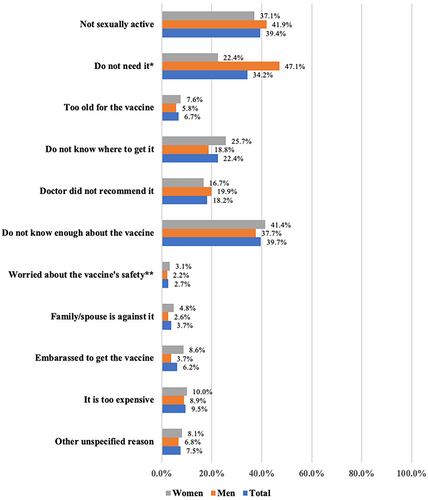
Table 3 Assessing the Odds for Vaccine Hesitancy by Student Characteristics (N=403)