
Figures & data
Table 1 Comparison of Nurses’ Satisfaction with the Work Environment Before and After the Visual and “6S” Management
Figure 1 The difference of the working environment before and after the implementation of the Visual and “6S” Management. (A and B) shown the environment before the method was implemented, (C and D) shown the environment after the method was implemented.
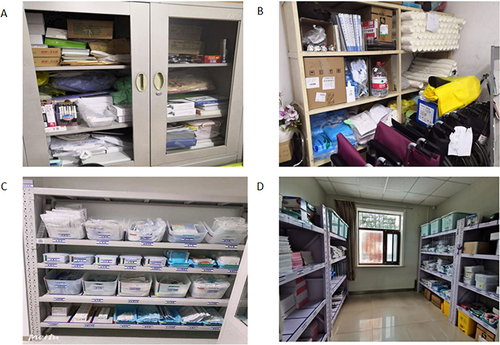
Table 2 Comparison of Warehouse Inventory Time in Each Ward Before and After Implementing the Visual and “6S” Management
Table 3 Comparison of Material Inventory Time in Each Ward During Shift Hand-Over Before and After Implementing the Visual and “6S” Management
Table 4 Comparison of the Incidence of Nursing Adverse Events Before and After “6S” Combined with Visual Management
Table 5 Comparison of ICU Rescue Efficiency and Time Before and After “6S” Combined with Visual Management
Table 6 Comparison of Rescue Efficiency and Time in the Emergency Department Before and After “6S” Combined with Visual Management