
Figures & data
Table 1 Participant demographics
Table 2 Career and Leadership Background
Figure 1 Impact of leadership positions (n=119). (participants could choose more than one option. Answers “missing/not applicable” were excluded).
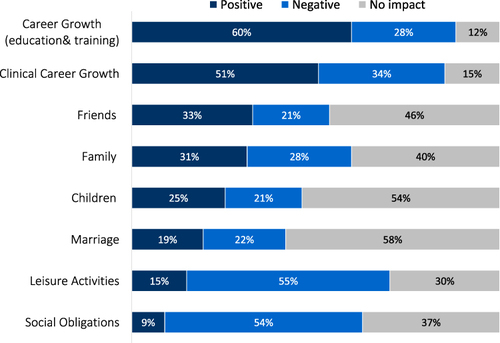
Figure 2 Areas impacting career choices (n=119). (participants could choose more than one option. Answers “missing/not applicable” were excluded).
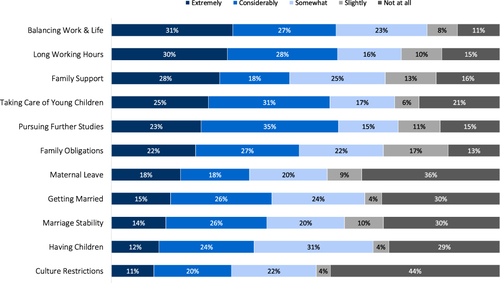
Figure 3 Approaches to increasing women representation in healthcare leadership positions (n=119). (participants could choose more than one option. Answers “missing/not applicable” were excluded).
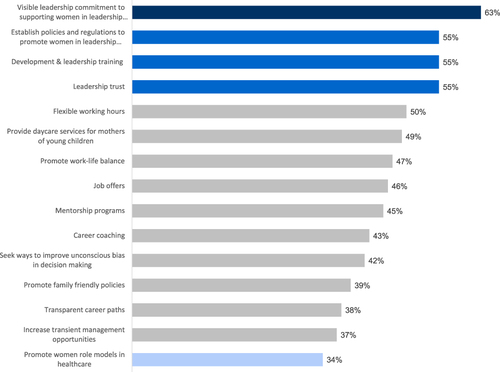
Table 3 Meaning of the Country’s 2030 Vision