
Figures & data
Figure 1 PRISMA Flow diagram. Adapted from Page MJ, McKenzie JE, Bossuyt PM, et al. The PRISMA 2020 statement: an updated :guideline for reporting systematic reviews. BMJ. 2021;372:n71. Creative Commons.
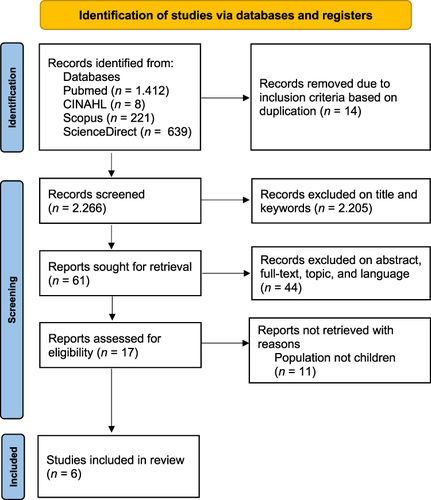
Table 1 Quality Assessment of Included Studies Using the Mixed Methods Appraisal Tool (MMAT) Version 2018
Table 2 Characteristics of Quantitative Studies and Mixed-Method Study (n = 4)
Table 3 Summary of Findings of Quantitative Studies and Mixed-Method Study (n = 4)
Table 4 Intervention Model and Outcomes of Quantitative Studies and Mixed-Method Study (n = 4)
Table 5 Summary of Findings of Quantitative Studies and Mixed-Method Study (n = 4)
Table 6 Characteristics of Qualitative Studies and Mixed-Method Study (n = 3)
Table 7 Interventions Model and Outcomes of Qualitative Studies and Mixed-Method Study (n = 3)
Table 8 Summary of Findings of Qualitative Studies and Mixed-Method Study (n = 3)