Figures & data
Table 1 Overview of Characteristics for the Microvascular Imaging Modalities
Figure 1 Schematic diagram of Photoplethysmography (PPG) waveform (Marker 1 is the first foot of the PPG waveform, marker 2 is the first peak of the waveform, marker 3 is The Valley, marker 4 is the second peak, and marker 5 is the second foot of the waveform; P1 and P2 indicate two positive waves respectively, V indicates the negative wave).
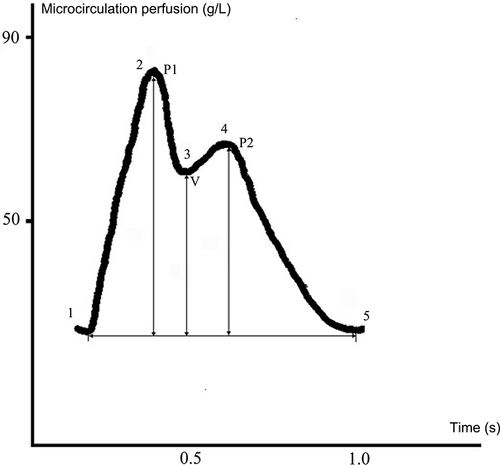
Figure 2 The comparison of PPG between hypertensive patients and normal young adults.
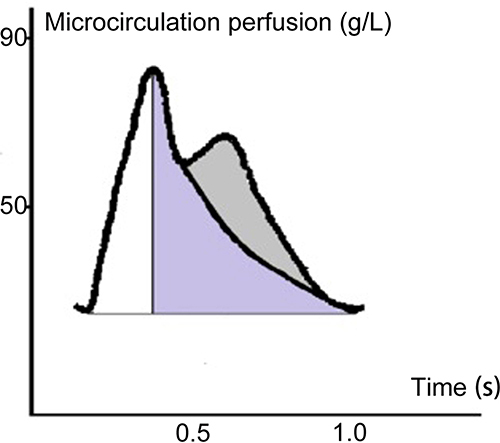
Figure 3 The comparison of PPG between hypertensive patients and patients with hypertension after the application of nitroglycerin. (A) PPG waveform examples of patients with hypertension. (B) PPG waveform examples of patients with hypertension after the application of nitroglycerin.
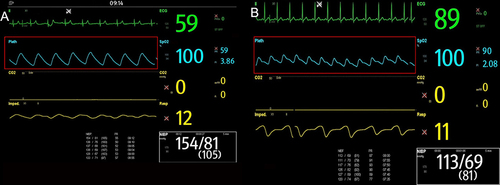
Figure 4 Schematic diagram of microcirculation. (A) Two Fluid Dynamics Diagrams: it seems that the vessel 1 had low resistance than vessel 2 because it had a greater cross-sectional area (electrical features); There were three components in vessel 1 (a, b and c). However, the fact is that the flow in vessel 1 drained more slowly than in vessel 2 because there was excessive friction in vessel 1, resulting in a greater resistance to flow. (B and C) The difference between parallel fluid pipeline and parallel circuit.
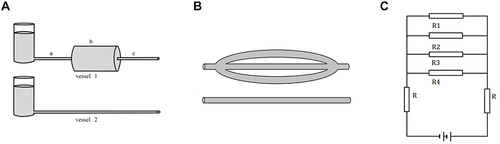
Figure 5 Diagram of the windkessel. (A) The elastic arteries and heart are similar with the windkessel and the pump, respectively. The change of air can somewhat represent the change of microvascular resistance during diastole and systole. (B) The components and structure of capillaries.
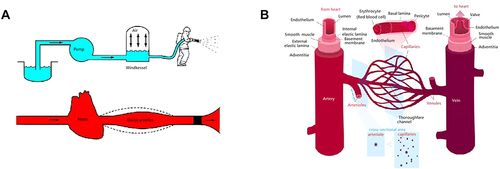
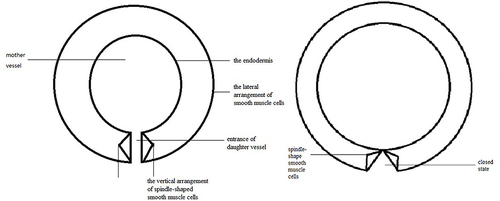
Figure 6 The blood vessel wall of Arteriovenous Anastomosis (AVA). The thick walls of AVAs are made up of circular and longitudinally organised smooth muscle fibres in cross-sections. The mother arterial segment’s vertical arrangement of spindle-shaped smooth muscle cells may resemble the acd valve, which regulates the opening of the AVA.
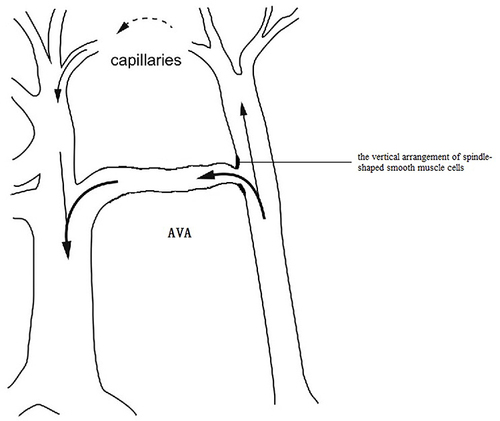
Figure 7 The structure diagram added at AVA. Mother and daughter vessels are in the spotlight. The construction of the fictitious AVA entrance serves as the link between the mother vessel and the daughter’s vessel. The muscle fibers are thickened and organised in the mother vessel’s direction to create a lip-like longitudinal structure.