
Figures & data
Table 1 Comparison of Mean Scores in Diagnostic Types
Figure 1 Comparison of mean scores and diagnostic types according to GPT-3.5 and GPT-4.0. (A) The mean scores of primary diagnoses in different systems, (B) The mean scores of secondary diagnoses in different systems, (C) The accuracy of primary diagnoses, (D) The accuracy of secondary diagnoses.
Abbreviations: AS, autoimmune system; CNS, central nervous system; LS, lymphatic system; RS, respiratory system.
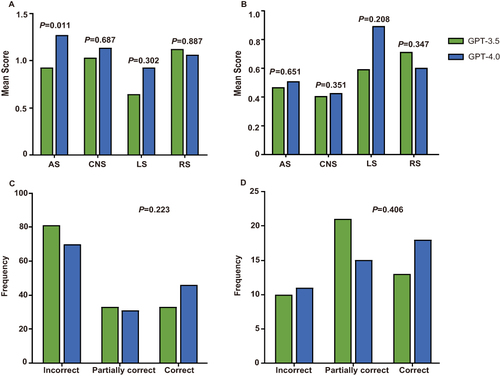
Table 2 Comparison of the Diagnostic Types in Primary Diagnoses
Table 3 Comparison of the Diagnostic Types in Secondary Diagnoses