Figures & data
Table 1 Delay in Seeing a Doctor Among Chinese Middle-Aged and Elderly and Its Influencing Factors (N=1034)
Figure 1 Descriptive results of the reasons for delay in seeing a doctor. (A) The distribution of reasons for delay among different factors. The brackets mean P-values for group comparison (univariate analysis). For unordered variables (eg sex, hukou), the P-value is the result of Chi-square test. For rank ordered variables (eg age, education level), the P-value is result of Kruskal–Wallis test. *P<0.05, **P<0.01, ***P<0.001. (B) Social support scale scores (class by reasons) (C) Loneliness scale scores (class by reasons) (D) Need scale scores (class by reasons). The arrow means the need scores of Reason 4 are lower than other reasons.
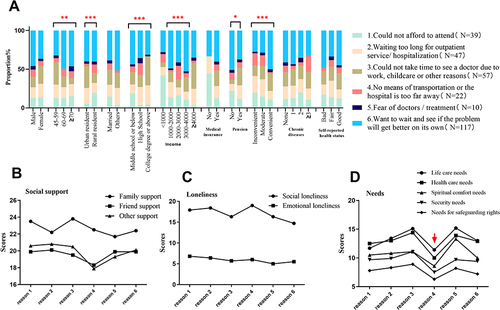
Figure 2 Descriptive results of delay time for delay in seeing a doctor. (A) The distribution of delay time among different factors. No statistically significant differences were found between the groups. (B). Social support scale scores (class by delay time) (C). Loneliness scale scores (class by delay time) (D). Need scale scores (class by delay time). The arrow means the need scores of > 4 weeks are a little higher than other delay time.
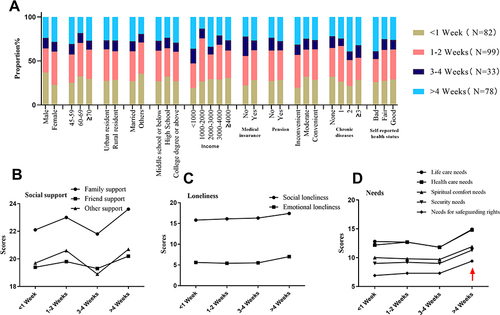
Figure 3 The major disease symptoms for delay in seeing a doctor.
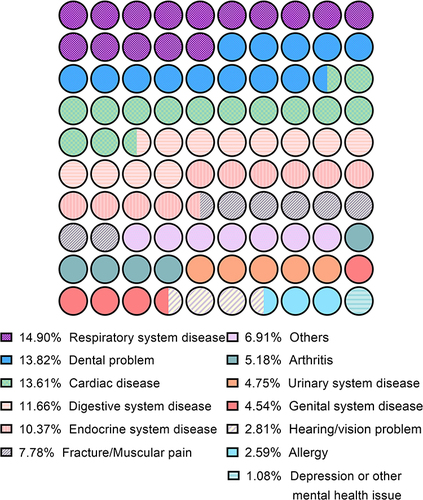
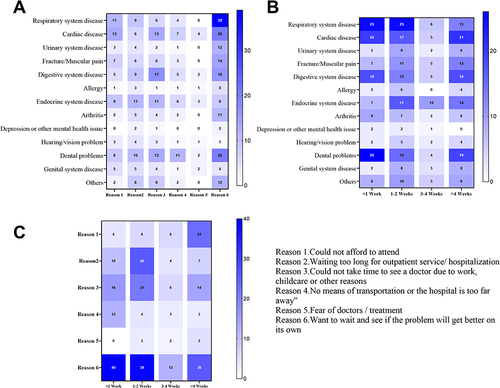
Figure 4 Interrelations among reasons for the delay, delay time, and disease symptoms. (A) The frequency heat map for the interrelation between the reasons for delay and disease symptoms (B). The frequency heat map for the interrelation between delay time and disease symptoms (C). The frequency heat map for the interrelation between delay time and the reasons for delay.