
Figures & data
Table 1 Sociodemographic Characteristics and KAP Scores
Table 2 Knowledge
Table 3 Attitudes
Table 4 Practices
Table 5 Pearson’s Analysis
Figure 1 Structural equation modeling.
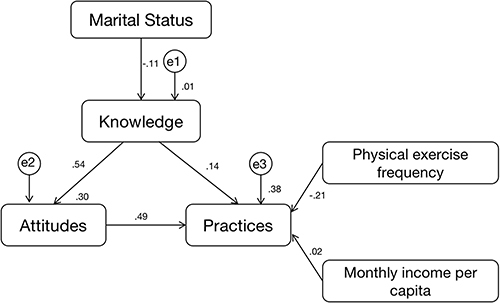
Table 6 Test Results of the Hypothesis
Table 7 Model Fitness Indices for the KAP Structural Equation Model