Figures & data
Table 1 Characteristics of All Physicians and Nurses Employed by Helios to Whom the Survey Was Addressed
Table 2 Values of Cronbach’s Alpha for the Three-Part Questionnaire
Figure 1 The pie chart shows the distribution of participants into types of care provider subdivided into physicians (a) and nurses (b). A total of 389 physicians answered the question in which clinic they work. This shows about 38% work in maximum care provider (148 physicians), 39% in specialist clinic (151 physicians) and 23% in basic care provider (90 physicians). A similar picture emerges for nurses with 561 participants. 41% work in maximum care provider (232 nurses), 41% in specialist clinic (214 nurses) and 21% work in basic care provider (115 nurses). Also shown is the period of use of the CPOE-CDSS in months separated into physicians and nurses (c). Nearly 50% uses the software between four to 12 months (207 physicians out of 389 and 280 nurses out of 561). 74 nurses and 65 physicians are using the software less than 3 months. (a) and (b): black = maximum care provider, grey = basic care provider, light grey = specialist clinic. (c): white with black dots = physicians; grey with diagonal stripes = nurses.
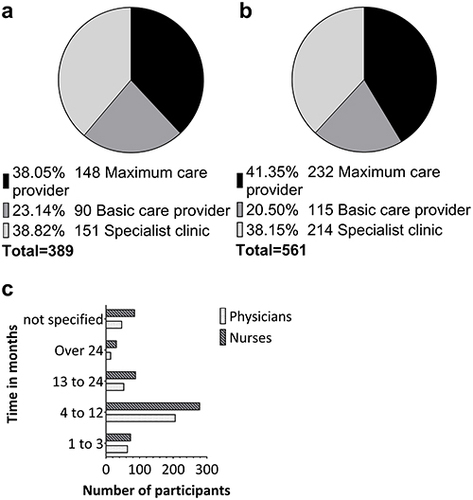
Figure 2 The mesh diagram is a representation of the positive feedback (statements: agree completely, agree rather) from the participants on the topic of satisfaction with the software. The dashed line within the mesh diagram marks 50%, light grey with dots symbolises physicians and black with triangle represents nurses.
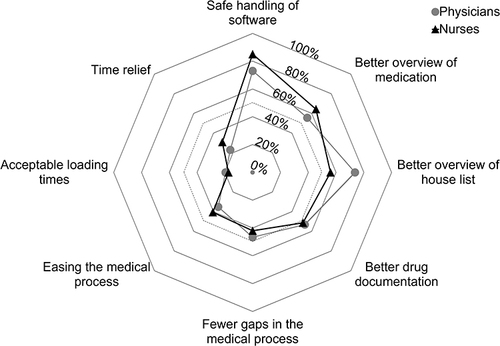
Figure 3 Illustration of the delays to the medication process before and after the introduction of the CPOE-CDSS from the perspective of physicians (a) and nurses (b) as column chart. The scale indicates the percentage frequency, the numbers above the columns are the absolute frequency of the answers. The left column of the grouping shows the frequency in delays before the introduction of CPOE-CDSS, the right columns show the frequency of delay from the same process after the introduction of the new software. The processes are numbered consecutively and can be found in the text box below the diagrams. White = delays in the prescription process from physicians perspective before CPOE-CDSS, white with black dots = delays in the prescription process from physicians perspective with CPOE-CDSS, light grey = delays in the prescription process from nurses perspective before CPOE-CDSS, grey with diagonal stripes = delays in the prescription process from nurses perspective with CPOE-CDSS.
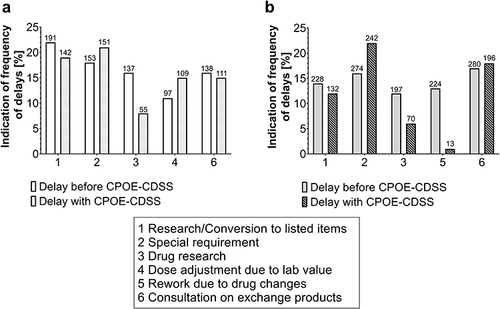
Figure 4 The mesh diagram (a) is a representation of the positive feedback (statements: agree completely, agree rather) from physicians and nurses of the implementation from the new software. The dashed line within the mesh diagram marks 50%, light grey with dots symbolises physicians and black with triangle represents nurses satisfaction. Physicians were also asked about their approval about prescriptions schemes (b), which is illustrated in a bar chart. The upper bar shows the opinion on “prescription schemes simplify daily work”, the lower one about the creation of prescription schemes. Both are divided in the categories agree completely (black with white dots), agree rather (dark grey with white dots), agree rather less (grey with black dots), do not agree at all (light grey with black dots) and not specified (white with black dots). For better visualisation, the rejection categories and the escape category are found in the negative part, the approval categories in the positive part. The 50% are represented by a dotted line.
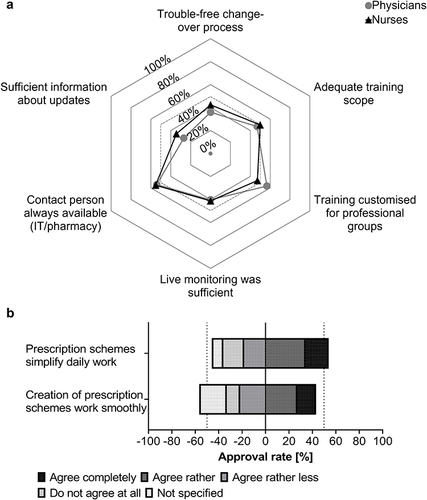
Figure 5 Response frequencies of physicians (dotted bars, (a) and nursing (bars with diagonal stripes, (b) on the topic of drug therapy safety as well as the response frequencies of physicians on the topic of therapy adjustment after warnings (c). Negative numbers indicate rejection or not specified in a and b, positive numbers indicate agreement, white with black dots/black stripes = not specified, light grey with black dots/black stripes = do not agree at all, grey with dots/stripes = agree rather less, dark grey with white dots/lines = agree rather, black with white dots/stripes = agree completely; the dotted line marks 50%. The adjustment of therapy is presented as column chart, the colours get lighter with less adjustment after initial warning of the CPOE-CDSS by physicians. To the right of the columns are the absolute response frequencies.
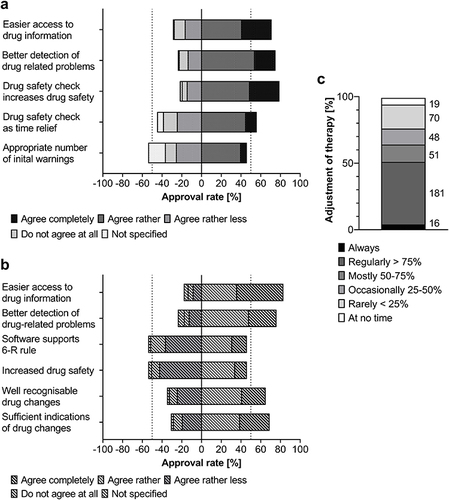
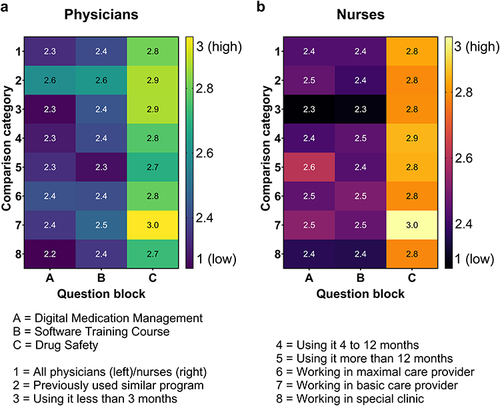
Figure 6 The heat map displays satisfaction levels in categories 1–8, divided into question blocks (A–C). Values above 2.5 indicate satisfaction and are represented by light colours (blue-green to yellow in a; pink to yellow in (b). Darker colours indicate lower satisfaction levels with the CPOE-CDSS or its implementation. 1 = All physicians (left, (a)/nurses (right, (b); 2 = Previously used similar program; 3 = Using CPOE-CDSS less than 3 months; 4 = Using CPOE-CDSS 4 to 12 months; 5 = Using CPOE-CDSS more than 12 months; 6 = Working in maximal care provider; 7 = Working in basic care provider; 8 = Working in special clinic. A = satisfaction with digital medication management; B = satisfaction with software training course; C = satisfaction with drug safety.