
Figures & data
Table 1 Characteristics of Children with Autism According to Their Parents (n = 109)
Table 2 Availability and Use of Speech Clinics According to the Parents (n = 109)
Table 3 Main Reasons for the Children’s Attendance at Speech Language Services (n = 109)
Figure 1 Parents’ reasons for letting their children attend speech language sessions outside their cities (n = 25).
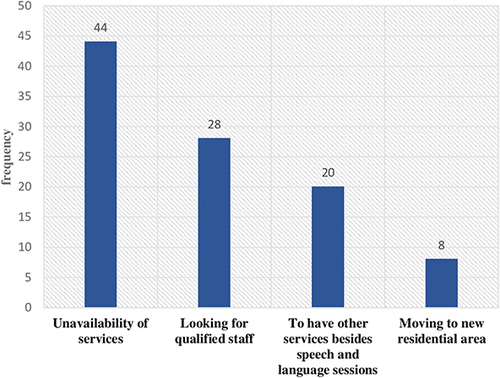
Figure 2 Pareto chart ranking the reasons for the discontinuation of the children’s communication sessions (n = 51).
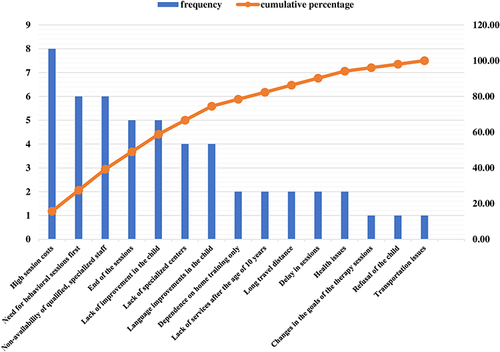
Table 4 Percentage Values of the Reasons for Discontinuing Communication Sessions: Pareto Analysis
Figure 3 Fishbone diagram illustrating the different factors contributing to the end of the children’s communication sessions.
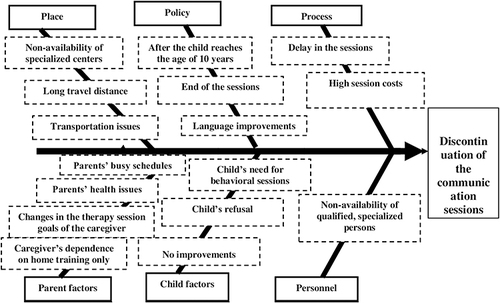
Table 5 Parents’ Levels of Satisfaction with the Speech and Language Services Provided on the Basis of the Characteristics of Children with Autism (n = 109)
Table 6 Parents’ Levels of Satisfaction with the Speech and Language Services Provided on the Basis of the Availability and Use Patterns of Speech Clinics (n = 109)
Table 7 Parents’ Levels of Satisfaction with the SLS Received (n = 109)
Table 8 Percentage Values of the Reported Needs by the Parents: Pareto Analysis
Table 9 Percentage Values of the Reported Concerns by the Parents: Pareto Analysis
Figure 4 Pareto chart ranking the perceived needs of the parents of children with autism (n = 42).
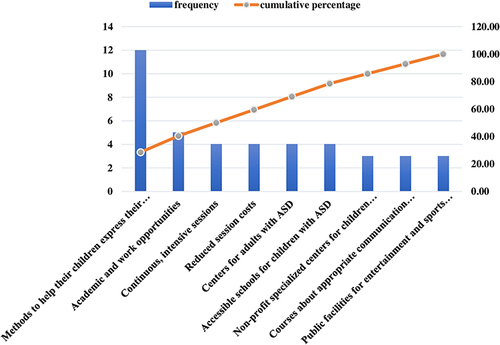
Figure 5 Pareto chart ranking the concerns of the parents of children with autism (n = 49).
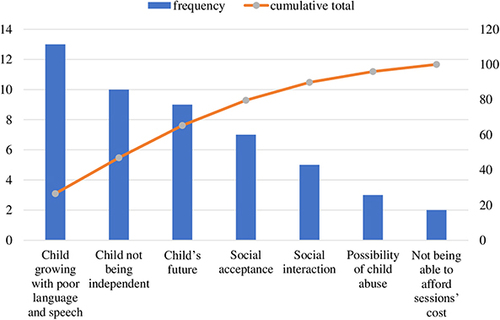
Table 10 Percentage Values of the Reported Difficulties by the Parents: Pareto Analysis
Figure 6 Pareto chart ranking the perceived difficulties of the parents of children with autism (n = 86).
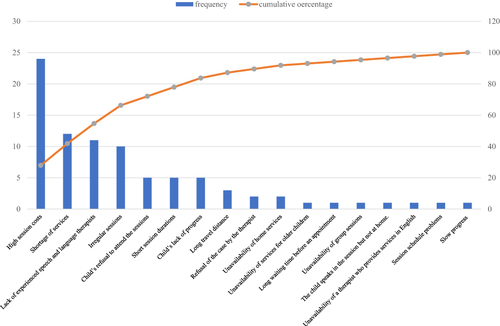
Figure 7 Pareto chart ranking the recommendations of the parents of children with autism (n = 86).
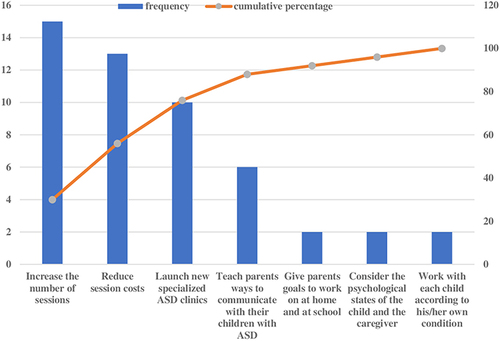
Table 11 Percentage Values of the Recommendations Made by the Parents: Pareto Analysis