Figures & data
Table 1 Demographics of the Patients with AKI-Requiring Dialysis in the Study
Figure 1 Workflow of the study design.
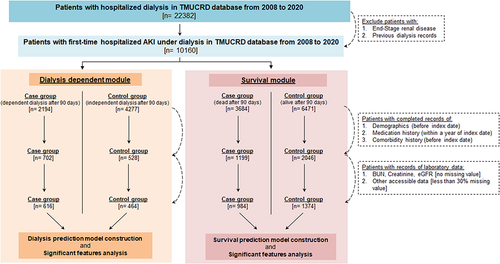
Figure 2 The AUROC for the final dialysis dependent prediction model.
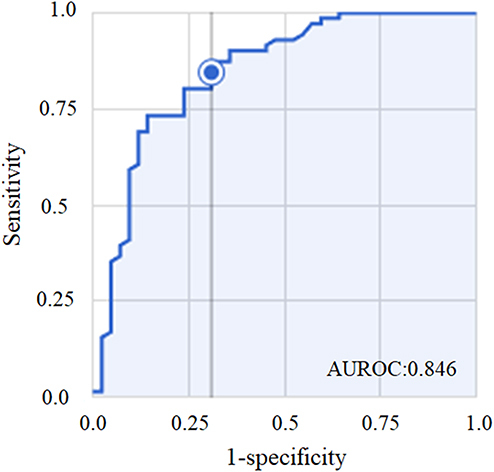
Table 2 The Value of the Top 10 Significant Features Between Two Groups of the Dialysis Dependent Prediction Model
Figure 3 The top 10 significant features related to the dialysis dependent prognosis. Baseline: lab data tested beyond 90 days before index date; Pre: lab data tested within 90 days before the index date; Post: lab data tested within 2–8 weeks after the index date.
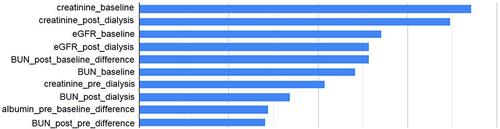
Figure 4 The AUROC for the final survival prediction model.
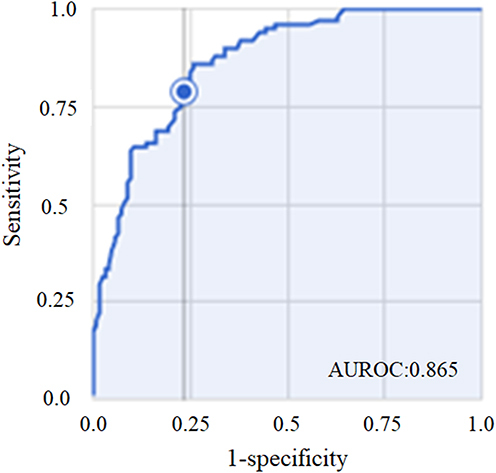
Table 3 The Value of the Top 10 Significant Features Between Two Groups of the Survival Prediction Model
Figure 5 The top 10 significant features related to the survival prognosis. Baseline: lab data tested beyond 90 days before index date; Pre: lab data tested within 90 days before the index date; Post: lab data tested within 2–8 weeks after the index date.
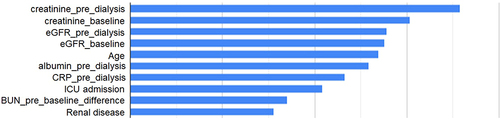
Figure 6 The paired scatterplot with box plots of dialysis dependent module. This illustrates the distribution of creatinine values at baseline and post-dialysis for the case group (depicted in red) and control group (depicted in green) within dialysis dependent module.
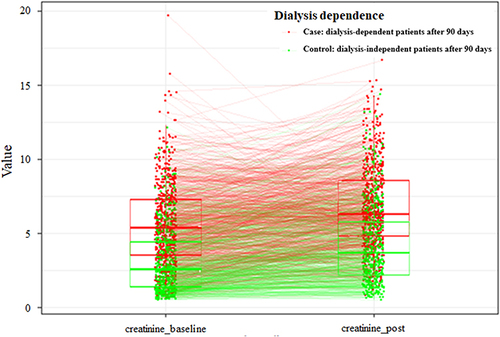
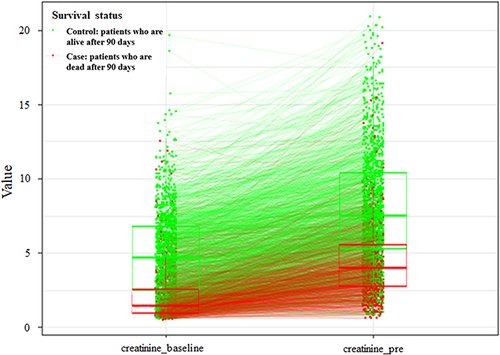
Figure 7 The paired scatterplot with box plots of survival module. The illustrates the distribution of creatinine values at baseline and pre-dialysis for the case group (depicted in red) and control group (depicted in green) within survival module.