Figures & data
Figure 1 PRISMA diagram of the study selection process of the randomized controlled trials (RCTs) included in the analysis for the treatment of COVID-19.
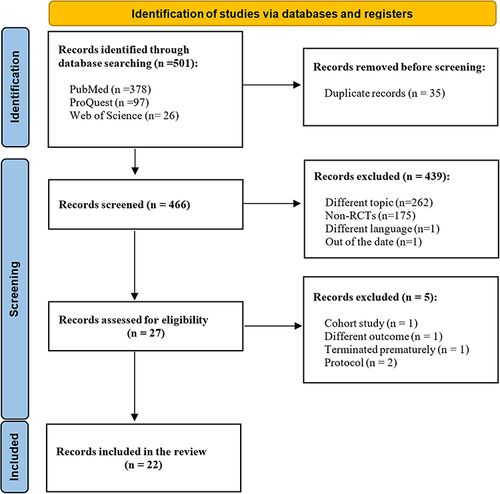
Table 1 The Demographic and Clinical Characteristics of the Randomized Controlled Trials (RCTs) Included in the Analysis for the Treatment of COVID-19
Table 2 Frequently Used Finding Measures in the Randomized Controlled Trials (RCTs) Included in the Analysis for the Treatment of COVID-19
Figure 2 Risk of bias assessment of the randomized controlled trials (RCTs) included in the analysis for the treatment of COVID-19.
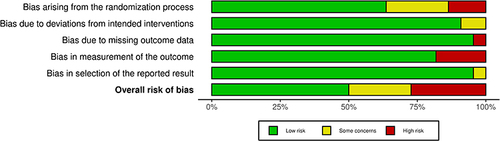
Table 3 Comparison of Reports with Registration Information of the Randomized Controlled Trials (RCTs) Included in the Analysis for the Treatment of COVID-19
Figure 3 Keyword co-occurrence network of the randomized controlled trials (RCTs) included in the analysis for the treatment of COVID-19.
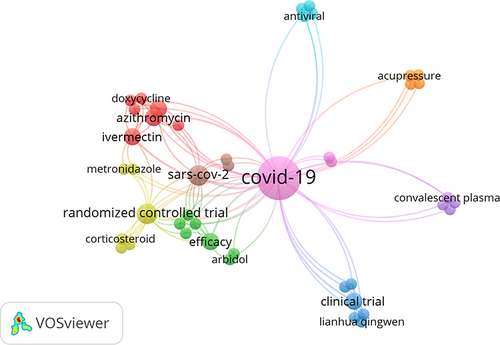
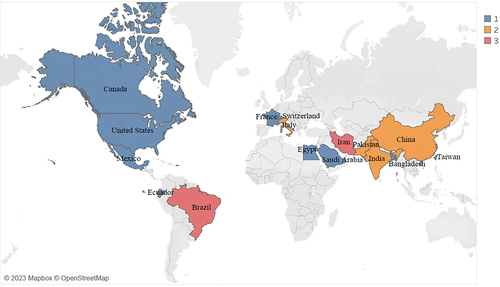
Figure 4 The global distribution of the randomized controlled trials (RCTs) included in the analysis for the treatment of COVID-19.