
Figures & data
Figure 1 Pain map for all the 45 pain sites.
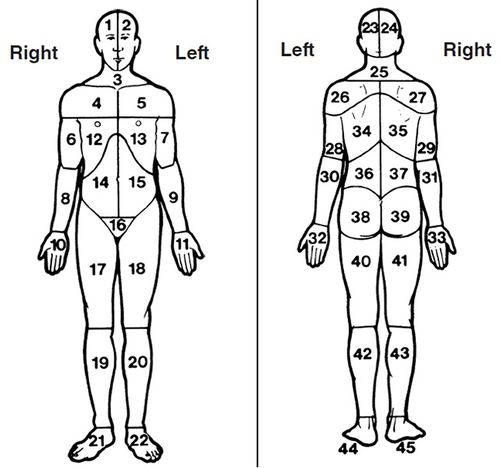
Table 1 Demographics and Clinical Characteristics for All Participants
Figure 2 Flowchart for included participants.
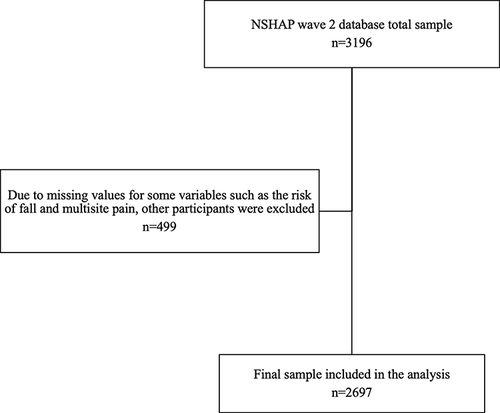
Table 2 Binary Logistic Regression for the Association Between Multisite Pain and Pain Intensity with Risk of Fall (Fallers Vs Non-Fallers)
Table 3 Binary Logistic Regression for the Association Between Multisite Pain and Pain Intensity with Frequent Falls (Frequent Fallers Vs Non-Frequent Fallers)