
Figures & data
Figure 1 Division of the hemithorax into 6 segments for lung ultrasound examination.
Abbreviations: PL, parasternal line; AAL, anterior axillary line; PAL, posterior axillary line.
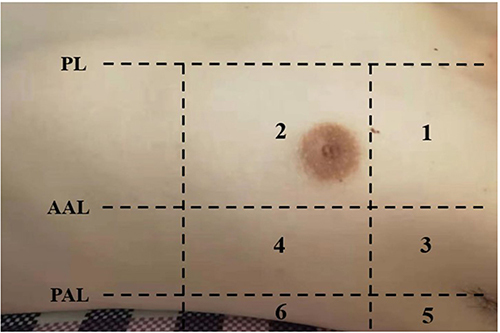
Figure 2 Lung ultrasound images with different scores. (A) Normal pattern “bat-sign” with A-lines parallel to the pleural line, score = 0; (B) ≥3 B lines arising from pleural line, score = 1; (C) Multiple subpleural consolidations separated by an irregular pleural line, score = 2; (D) Large-sized consolidation, score = 3. Arrow indicates corresponding pathologic findings of each figure.
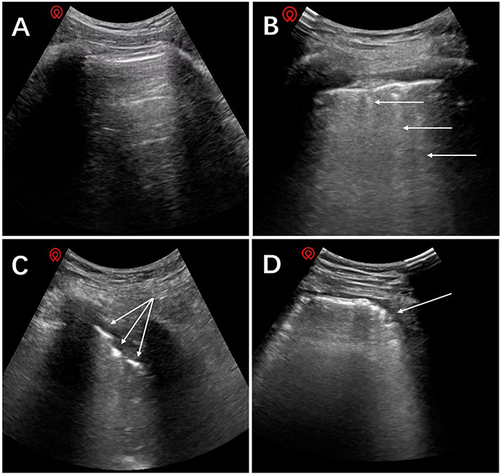
Table 1 Demographic Data and Surgical Details
Figure 3 Flowchart of participants.
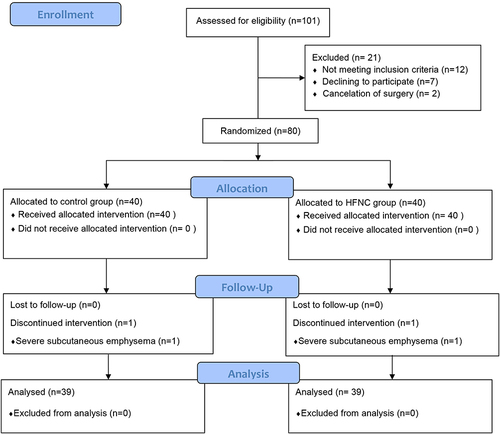
Table 2 Lung Ultrasound Measurements at Different Time Points
Table 3 Postoperative Variables Between the Control and HFNC Groups