
Figures & data
Table 1 Representation of the Time Spent for Sub-Processes in Minutes
Figure 1 Satisfaction with UDDS from the perspective of the nursing staff. The results are presented in percentages with the following scale levels: dark red: do not agree at all, light red: agree rather less, light blue: agree rather, dark blue: agree completely; UDDS = Unit-dose dispensing system.
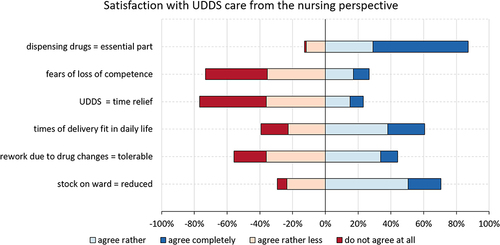
Figure 2 Stock-keeping on ward of the drugs by tablet count. Second quarter 2019 (white) versus second quarter 2022 (green) shows a significant reduction in immediate ward demand for the drugs metoprolol 47.5 mg tablets (A), metformin 1,000 mg tablets (B) and metamizole 500 mg tablets (C) (****p = 0.0001; paired t-test for metoprolol and metformin, Wilcoxon test for metamizole). The results are shown as a box-whisker plot (5–95 percentiles).
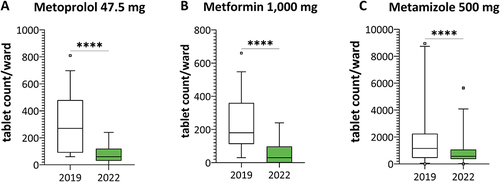
Figure 3 Representation of the mean time spent per patient per day on the ward. Before the introduction of the UDDS (to white), four weeks after introduction of the UDDS (t1 light green) and from six months after introduction of the UDDS (t2 green). Total time spent on medication-related processes (median ± SEM).****Significant change between t0 and t2 (****p = 0.0001) using Mann–Whitney U-test ####=significant change between t0 and t1 (####p = 0.0001) using Mann–Whitney U-test; min = minutes.
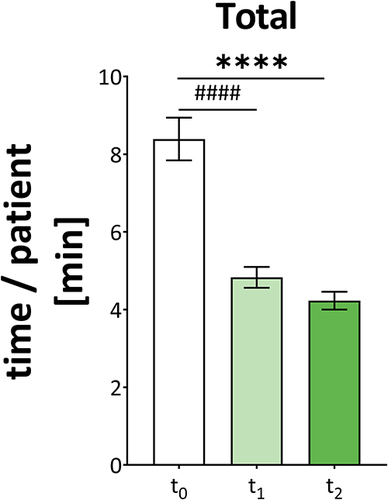
Table 2 Presentation of the Key Data Required for the Calculation of Relieved FTE Nurses for HK-EF Taking Gross and Net Working Time into Account