
Figures & data
Table 1 The Clinical Characteristics and Ultrasonic Parameters of the Three QRS Groups. P: Level of Significance
Table 2 LVSDI in Multivariable Logistic Regression of BBB. Other Included Variables: Age, Hypertension, Diabetes, QRS Duration, LVEF. RR: Risk Ratio; P: Level of Significance
Table 3 Partial Correlation Analyses of LVSDIs, LVEF and QRS Duration. R: Correlation Coefficient; P: Level of Significance
Figure 1 Comparison of LVSDIs between the HF and NHF groups. Nonparametric tests of two independent samples with the Mann–Whitney test are used for the difference examination.
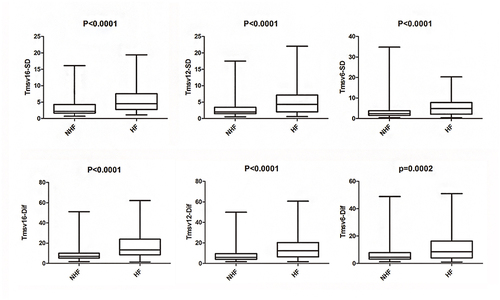
Figure 2 The ROC curve analysis of LVSDIs between patients with dilated cardiomyopathy (HF) and non-heart failure (NHF) participants.
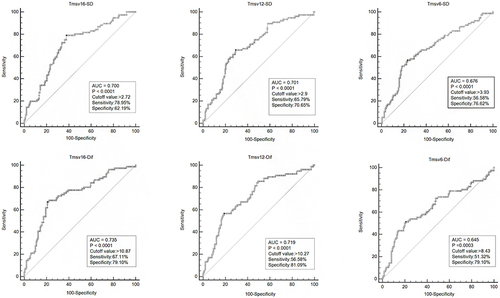
Figure 3 Comparison of ROC curve using the DeLong method between the LVSDI with the maximum AUC and NT-proBNP to differentiate patients with dilated cardiomyopathy (HF) in the three QRS subgroups and the overall participants.
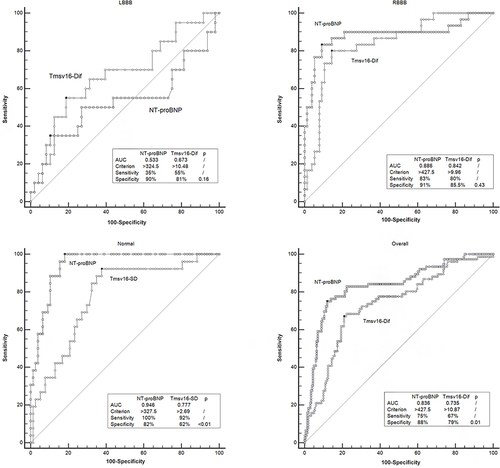
Table 4 Multivariable Logistic Binomial Regression of Factors Associated with Heart Failure (DCM) in Three QRS Subgroups and Overall Subjects. RR: Risk Ratio; P: Level of Significance