Figures & data
Table 1 Inclusion & Exclusion Criteria
Table 2 Lawshe’s Content Validity Ratios (CVR) for an Item and Content Validity Index (CVI) Value
Table 3 Descriptive Analysis of the Data Collected
Figure 1 Score distribution to stigma questionnaire by the study participants.
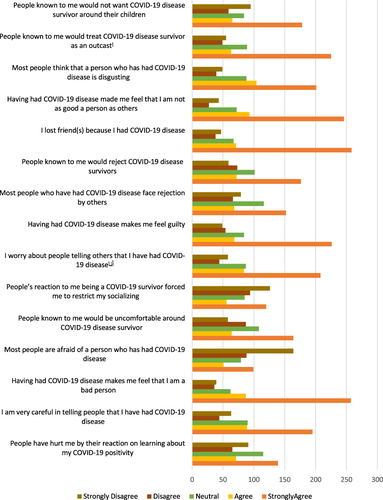
Figure 2 Distribution of scores (a).Depicted as a histogram (b). Normal Q-Q plot of the total score as against stigma questionnaire.
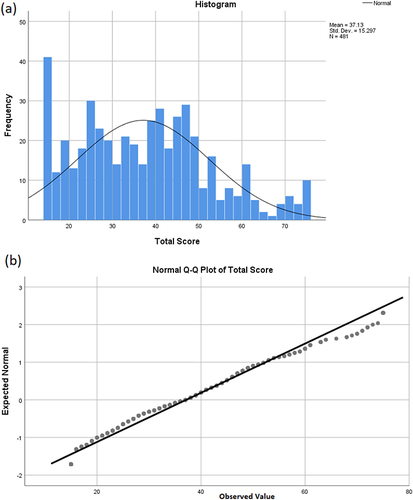
Table 4 One-Sample t-Test for Each Domain
Table 5 Descriptive Analysis of the Domain and Corresponding Responses
Table 6 Predictors of COVID-19 Perceived Stigma
Table 7 Thematic Analysis of Open-Ended Questions and Free-Text Comments
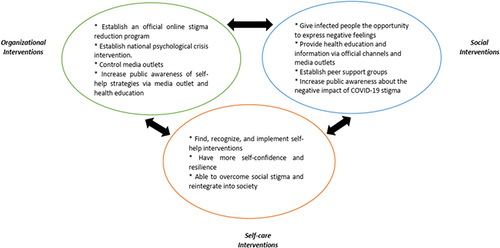
Figure 3 Preferences stigma interventions for recovery and integrations following the COVID-19 surge.