
Figures & data
Figure 1 Flowchart summary of the study methodology.
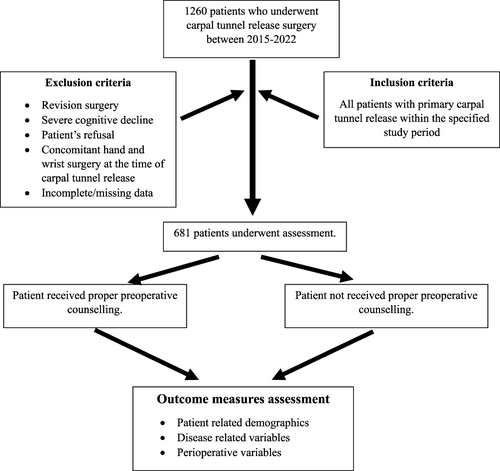
Table 1 Summary of the Demographic and Disease Related Variables
Table 2 Summary of the Perioperative Variables
Table 3 Comparative Analysis Between Counselling Groups Using the Chi-Square Statistical Test for Categorical Variables Analysis. Student’s t-Test Was Used for Continuous Variables
Data Sharing Statement
The data that support the findings of this study are available upon appropriate request from the corresponding author. The data are not publicly available due to privacy or ethical restrictions.