Figures & data
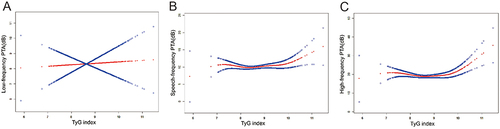
Figure 1 Flow chart of the selection.
Notes: described the selection procedure of study participants. Audiometry examinations were performed in adults aged 20–69 years from the 2015–2016 NHANES data. Participants without complete data on hearing levels, otoscopic test, tympanogram test, or Triglyceride Glucose index were excluded, as well as participants with abnormal otoscopic results, poor-quality tympanogram results, or tympanogram with compliance of ≤ 0.3mL. Ultimately, the study included 1226 adults.
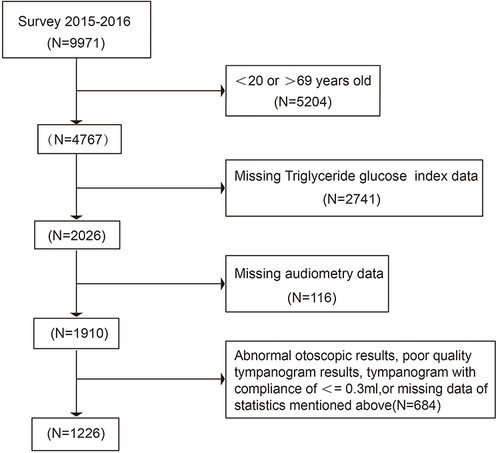
Table 1 The Weighted Demographic Characteristics of Study Participants
Table 2 The Univariate Analysis of Comparison of Variables in Hearing Threshold Group
Table 3 Multivariable Linear Regression Models for Outcome of Hearing Thresholds
Table 4 The Results of Two-Piecewise Linear Regression Model Between TyG Index and Hearing Thresholds
Figure 2 The relationship between TyG index and hearing threshold shifts: (A) low-frequency PTA, (B) speech-frequency PTA and (C) high-frequency PTA.
Notes: used smooth curve fittings to explore the relationship between TyG index and hearing threshold shifts, after the adjustment of potential confounders. Finally, TyG index shows a non-linear relevance to the speech-frequency and high-frequency PTAs, but not to low-frequency PTA. The fitted smooth curves were approximately U-shaped.
Abbreviations: PTA, pure tone average; TyG index, triglyceride-glucose index.