Figures & data
Table 1 Overview of the Patient (N = 3)
Figure 1 Example of the text annotation. The words with the colored background were tags. Patient Views and Preferences-Care-Treatment and Physical Status-Pain tags were given to the first line, and Contextual Features-Family and Contextual Features-Visit-Admission tags were given to the second line. The author made this figure’s text as an example.
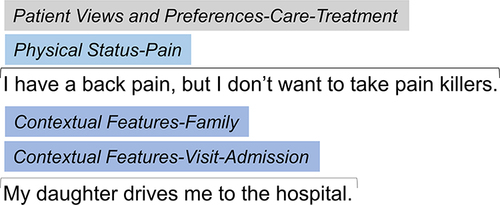
Figure 2 The prototyped application to integrate all annotated results. (a) The numbers represent the number of given tags for each tag. (b) We created QOL dedicated display because QOL category has more tags than other categories. (c) The list of paragraphs containing tagged sentence are displayed by selecting a tag or tags of interest. Author made this figure’s data as an example.
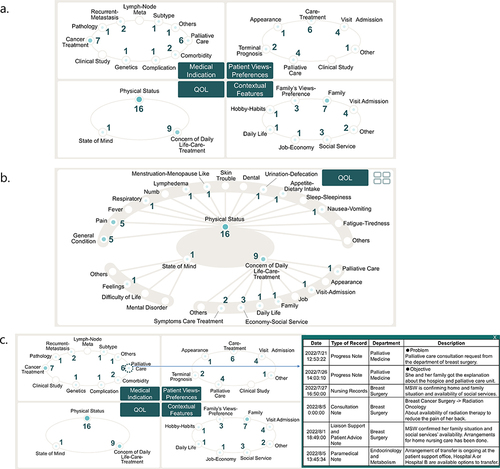
Table 2 Number and Ratio of Given Tags in Each Category
Table 3 Medical Records and Number of Given Tags
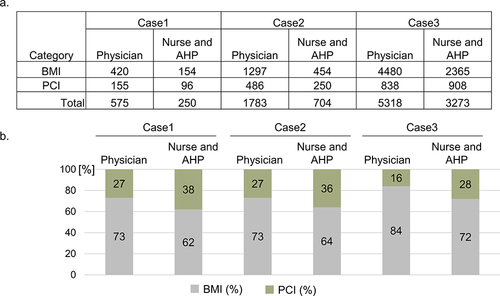
Figure 3 The number and ratio of given BMI and PCI tags to the text of Physician and Nurse/AHP in each case. (a) The table of the number of tags. (b) The graphs of the ratio in each case.