
Figures & data
Figure 1 Study flow diagram.
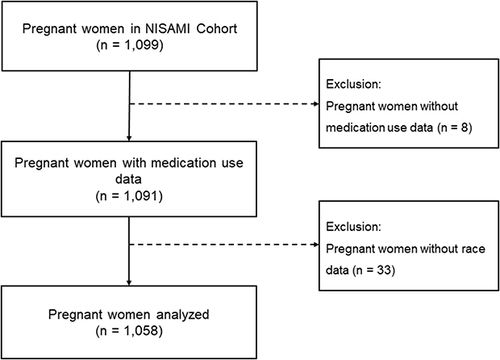
Table 1 Characteristics of the Study Population by Race. NISAMI Cohort Study, Brazil, 2012–2014 (N = 1058)
Figure 2 Percentage of patients who used medication during pregnancy by race. NISAMI Cohort Study, Brazil, 2012–2014 (n = 1058).
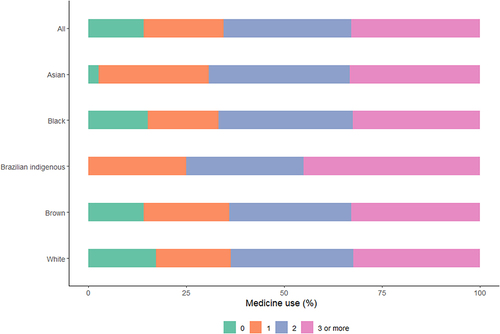
Table 2 Prevalence of the Use of at Least One Medication During Pregnancy According to Race According to the Anatomical Therapeutic Chemical Classification System (ATC) Level. NISAMI Cohort Study, Brazil, 2012–2014 (n = 892)
Figure 3 Percentage of the top medication classes taken during pregnancy by race. NISAMI Cohort Study, Brazil, 2012–2014 (n = 892).
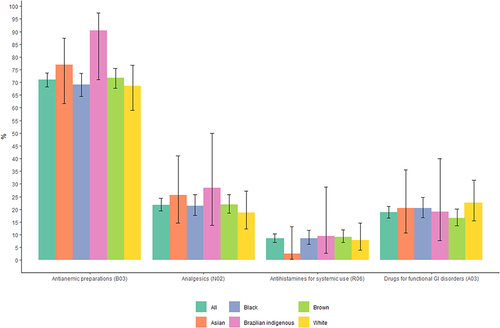
Figure 4 Percentage of potentially risky medication use during pregnancy by race. NISAMI Cohort Study, Brazil, 2012–2014 (n = 261).
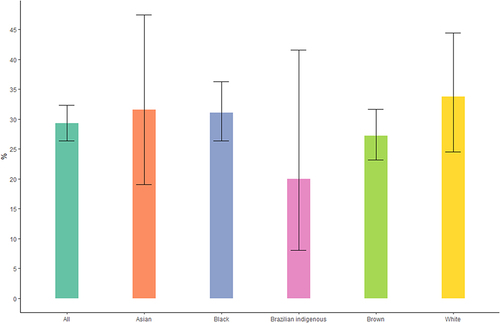
Table 3 Crude Prevalence Ratio of Medication Use According to Race by Study Population Characteristics. NISAMI Cohort Study, Brazil, 2012–2014 (n = 892)
Table 4 Factors Associated with Medication Use During Pregnancy According to Race in the Study Population. NISAMI Cohort Study, Brazil, 2012–2014
Table 5 Crude Prevalence Ratio of Potentially Risky Medication Use During Pregnancy According to Race According to Study Population Characteristics. NISAMI Cohort Study, Brazil, 2012–2014 (n = 261)
Table 6 Factors Associated with Potentially Risky Medication Use During Pregnancy According to Race in the Study Population. NISAMI Cohort Study, Brazil, 2012–2014