
Figures & data
Figure 1 Flowchart of the patients.
Abbreviation: NICU, Neonatal Intensive Care Unit.
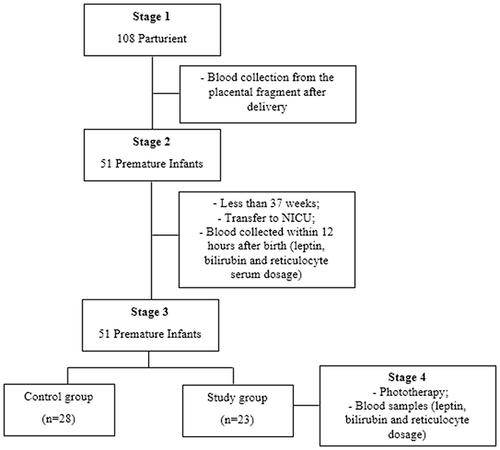
Table 1 Demographic Characteristics of Premature Infants in the Study and Control Groups
Table 2 Comparison Between the Moments of Evaluation 2 to 2 of the Study Group, Regarding Leptin Concentration (n=23)
Table 3 Descriptive Analysis of Reticulocyte Values at Various Time Points After Phototherapy (n = 12)
Table 4 Evaluation of the Association Between Bilirubin and Leptin, and Nutrition and Leptin (n = 23)
Table 5 Association Between BMI and Leptin