
Figures & data
Table 1 Baseline Indexes
Figure 1 (A and B) Correlation and clustering analyses show a significant clustering trend of the included variables, indicating the presence of multiple variables pointing to a fixed characteristic. (C) The analysis of the VIF values between the variables included suggests a high degree of covariance between the variables. (D and E) The results of lasso regression and cross-lasso regression analyses show that the number of variables decreased after regularized data processing and stabilized after cross-sampling. (F) After lasso regression analysis, the VIF values of the included variables suggest a significant improvement in the covariance between the variables as compared to the earlier analysis.

Table 2 Univariate and Multivariate Analysis
Figure 2 (A–E) ROC curves for models 1–5 in the training set, respectively; (F–J) calibration curves of models 1–5 in the training set, respectively; (K–O) ROC curves of models 1–5 in the validation set, respectively; (P–T) calibration curves of models 1–5 in the validation set, respectively.
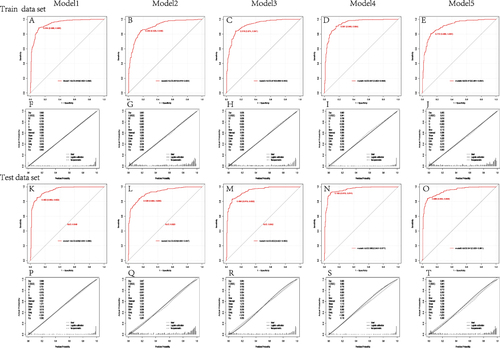
Figure 3 (A and B) ROC curves of the models based on the Random Forest and the Xgboost methods in the training set, respectively; (C and D) ROC curves of the models based on the Random Forest and the Xgboost methods in the validation set, respectively; (E) order of importance of the variables in the model based on Random Forest; (F–H) explanation of the importance of SHAP to the Xgboost variables in the Xgboost method.
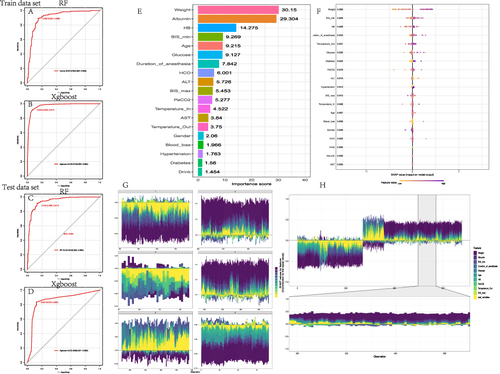
Table 3 NRI and IDI Values Compared Between Model 6 and Models 1, 2, 3, 4, and 5 in the Training and Validation Sets
Figure 4 (A) Variable UpSet plots of different models; (B) plots of the changes in order of importance of the variables among different models; (C and D) ROC and calibration curves of model 6 in the training set, respectively; (E and F) ROC and calibration curves of model 6 in the validation set, respectively.
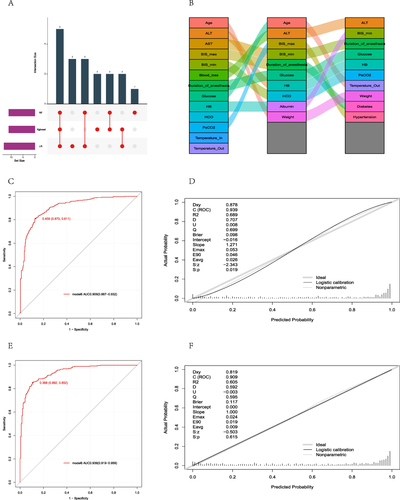
Figure 5 (A) Differences in NRI and IDI between model 6 and models 1–5 in the training and validation sets; (B–K) comparison of the NRI distribution plots of model 6 and models 1–5 in the training and validation sets, respectively.
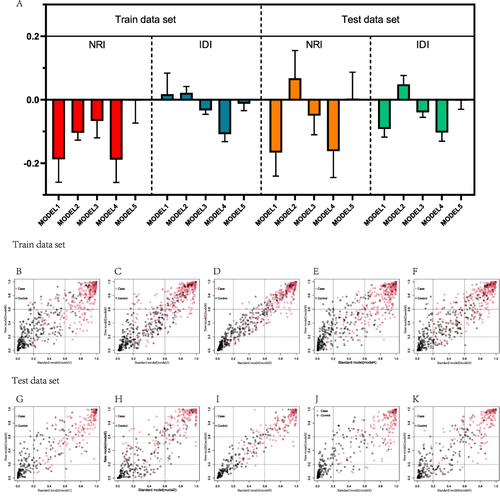
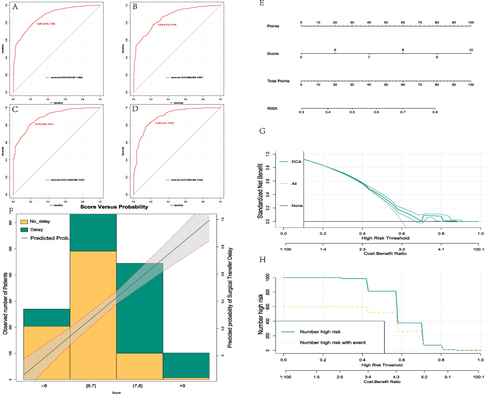
Figure 6 (A–D) ROC curves of the score model for the full dataset, the training set, the validation set, and the external data, respectively; (E) nomogram plot of the score model; (F) histogram of the scoring distribution and the predicted probability distribution; (G and H) DCA and CIC plots of the score model, respectively.
Data Sharing Statement
The datasets generated and analysed during the current study are not publicly available but are available from the corresponding author (Ying Qian) on reasonable request.