Figures & data
Table 1 Comparison of the General Information of the Two Groups
Table 2 Results of ROC Curve Analysis of Different Indicators
Figure 1 Least absolute shrinkage and selection operator (LASSO) regression plot related to bleeding risk. (A) Coefficient path; (B) Cross-validation curve.
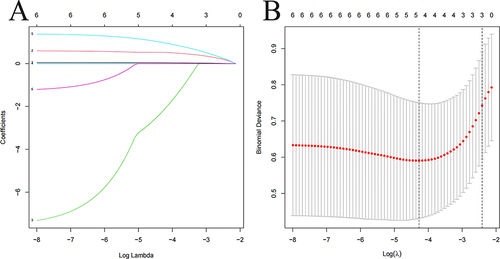
Table 3 Multifactorial Logistic Regression Analysis of Predictors Related to Bleeding Risk
Figure 2 Bleeding risk prediction nomogram.
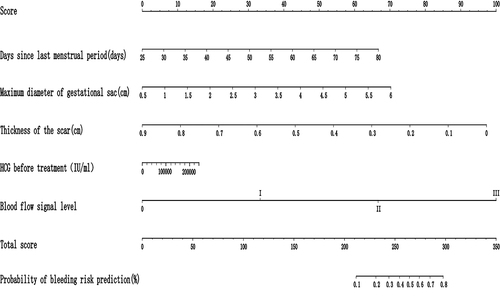
Figure 3 Receiver operating characteristic (ROC) curve of the nomogram of bleeding risk prediction.
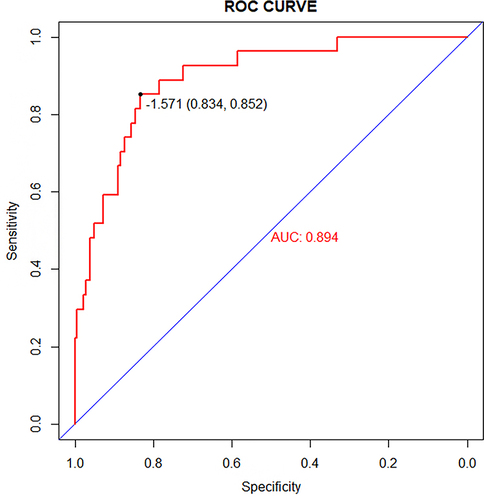
Figure 4 Calibration curve of the hemorrhage risk prediction nomogram.
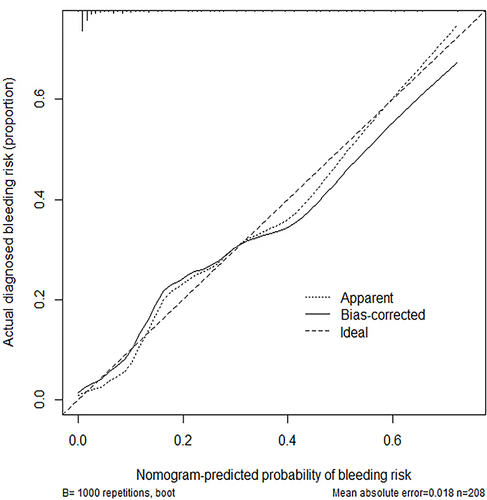
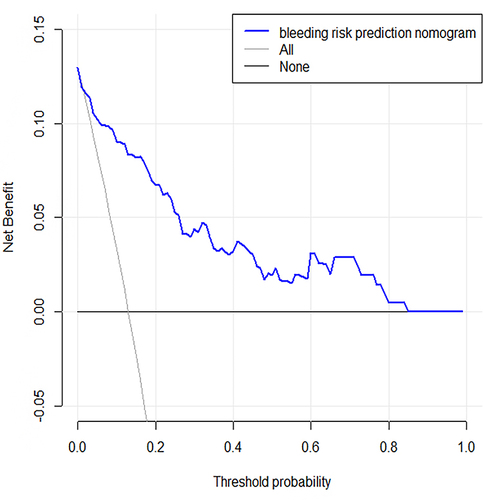
Figure 5 Decision curve of the hemorrhagic risk prediction nomogram.