
Figures & data
Table 1 Socio-Demographic Information on Respondents Who Have Never Provided HMCS versus Those Who Have Provided (n, %)
Table 2 Motivation to Provide HMCS by Medical Staffs of Community Health Service Institutions (n, %)
Figure 1 Multivariate analysis of potential factors influencing the motivation of respondents to implement HMCS (N = 673). The analysis examines three dependent variables: (A) provision of HMCS (question 1), (B) frequency of HMCS (question 2), and (C) types of HMCS provided (question 3.2). Model (A) was constructed by binary logistic regression. Model (B) and (C) were constructed by Poisson regression.
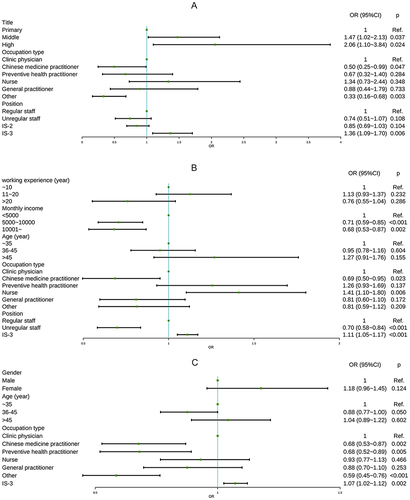
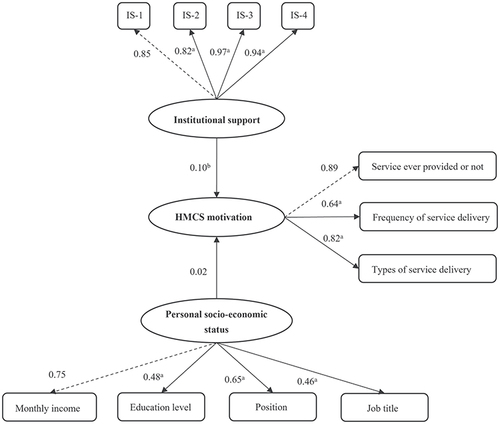
Figure 2 The structural model of the relationship between institution support, personal socio-economic status, and HMCS motivation in medical staff (N = 673). ap < 0.01. bp < 0.05. Standardized coefficients are reported. Observed variables are depicted as squares, latent variables as ovals. The observed variable pointed to by the dotted line is the reference. When constructing the SEM, “position” was encoded as 1 for “regular staff” and 0 for “unregular staff”.
Data Sharing Statement
Data are available upon reasonable request from the corresponding author.