Figures & data
Figure 1 Flowchart for inclusion of research subjects and analytical methods. MSE, Mean Square Error; R2, R-squared.
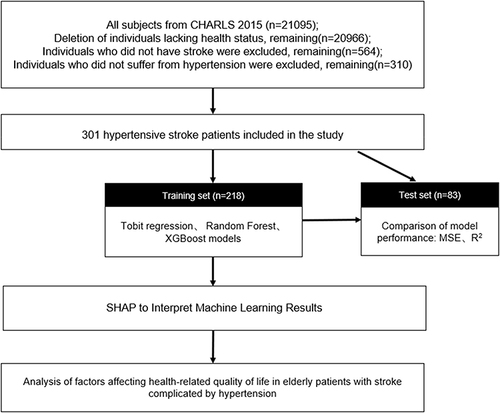
Table 1 The EQ-5D-3L Scale Based on the Health Utility Value Point System of Chinese Residents
Table 2 Basic Information, Health Utility Values and Univariate Analysis in Hypertensive Stroke Patients(n=301)
Table 3 Tobit Regression Modelling of Factors Influencing HRQoL in Hypertensive Stroke Patients(n=301)
Table 4 Comparison of Model Performance
Figure 2 Importance ranking of Random Forest outcome features(n=218).
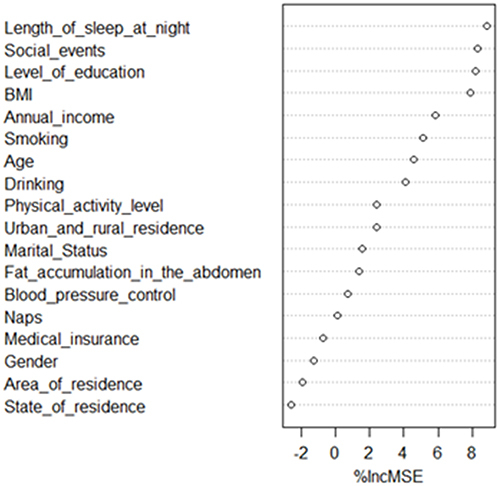
Figure 3 Chart representing importance ranking of features obtained from result of XGBoost classifier(n=218).
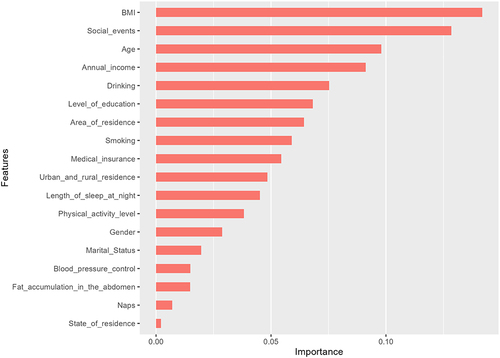
Figure 4 Contribution of each characteristic to the predicted value for a single sample.
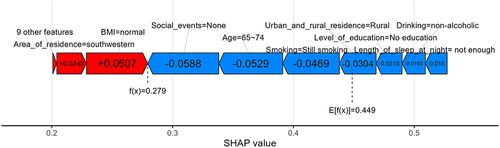
Figure 5 Ranking of feature importance(n=218).
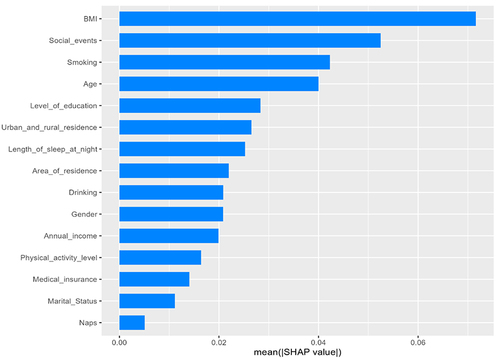
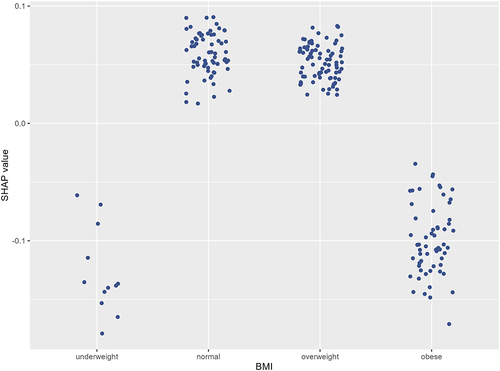
Figure 6 BMI Contribution Map(n=218).