
Figures & data
Table 1 Pathological Results of Liver Biopsy
Table 2 Gender and Age Distribution Characteristics of Patients
Figure 1 Hepatic histopathology image (Magnification 200×). (A) Hepatitis B Cases, (B) Chemical toxic liver injury, (C) Primary biliary cirrhosis, (D) Autoimmune hepatitis, (E) Non-alcoholic steatohepatitis, (F) Gilbert syndrome.
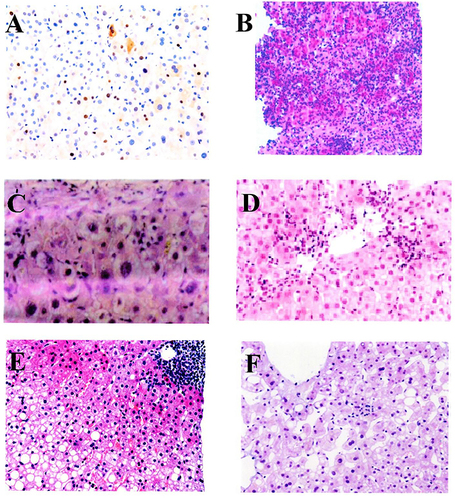
Table 3 Comparison of Liver Function Indicators Before and After Liver Biopsy ()